How to Track Software Delivery: A Practical Setup Guide
TRACK LESS, KNOW MORE
A practical guide to tracking software delivery: which events to capture, the few metrics that matter, honest baselines, and a cadence that sticks.
TL;DR: Tracking software delivery takes less than you think: wire four questions to timestamps you already have. What shipped? How long does work take, stage by stage? Where does it wait? What came back broken? Capture PR and ticket events, compute a handful of trended metrics, baseline against your own history (with published bands as a labeled reference, not a target), and review on a fixed cadence that ends in one change at a time. Everything else - per-person counts, forty-chart dashboards, quarterly metric theater - is decoration.
"How do we track delivery?" is usually asked right after a quarter that felt busy and shipped little. The bad news: most first attempts produce either a spreadsheet someone updates by hand for six weeks and then abandons, or a dashboard with forty charts and no opinion. The good news: the honest version is smaller than you think, because the data already exists. Every PR, commit, ticket transition, and deploy is timestamped. Tracking delivery means turning those timestamps into a few questions you can answer every week without asking anyone to fill anything in.
What does "tracking delivery" actually mean?
It means being able to answer four questions from records, not recollection:
- What shipped? Merged and deployed work, linked to the actual PRs, not the standup summary of it.
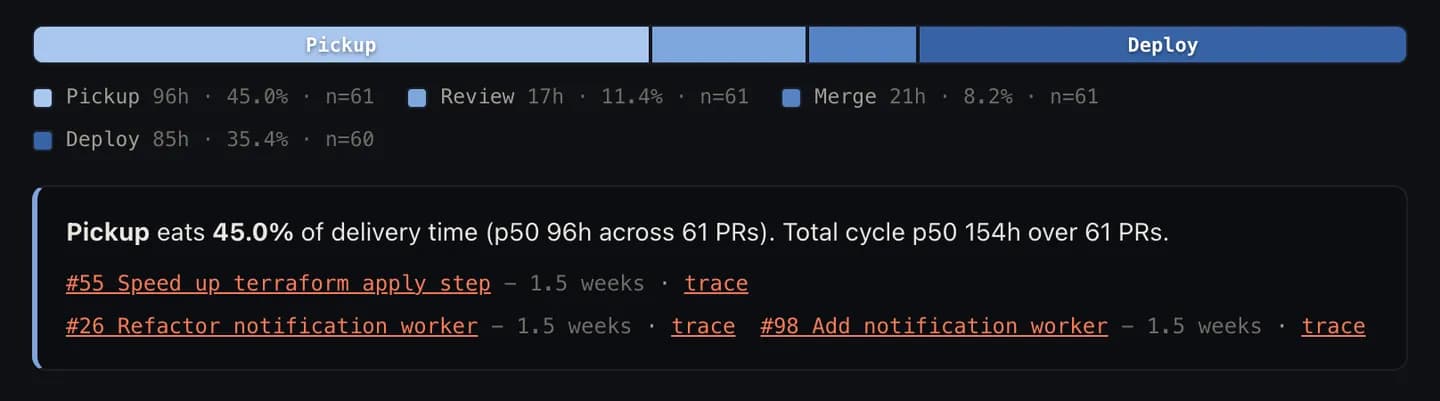
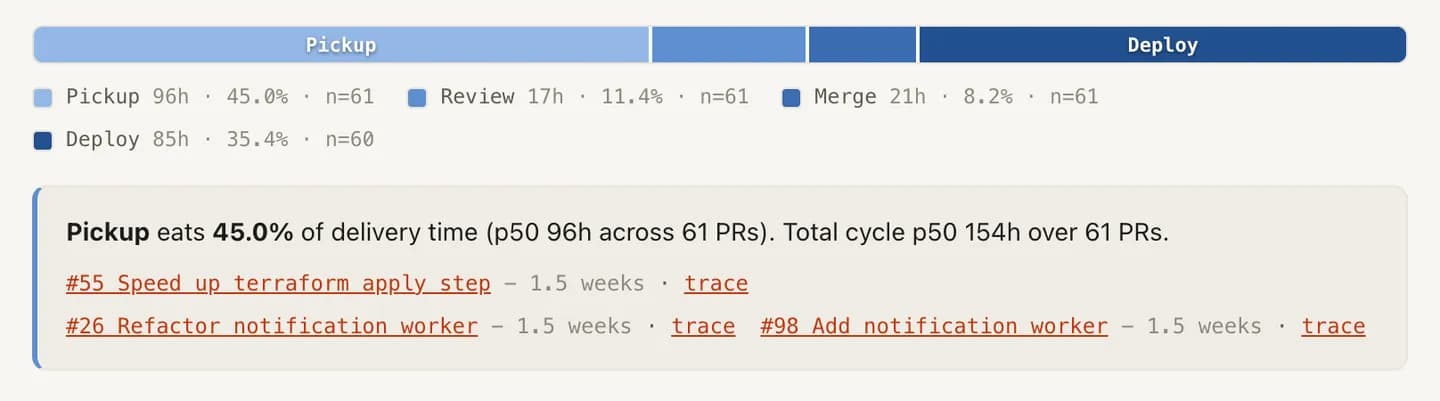
- How long does work take? Not one blended number but the anatomy of cycle time: coding, waiting for review, in review, waiting to deploy.
- Where does it wait? Queues are where delivery time actually goes; the work itself is usually the minority of the elapsed clock.
- What came back? Reopened tickets, hotfix-shaped follow-ups, rework. Speed that doesn't stick isn't speed.
If your current setup can't answer those four from timestamps, you aren't tracking delivery yet - you're narrating it.
Step 1: pick the smallest metric set that answers the questions
The temptation is to track everything. Resist it. The research case for a small set is strong: the DORA program has spent a decade showing that four keys - lead time, deployment frequency, change failure rate, recovery time - separate performance tiers, and the Accelerate book behind it found high-performing delivery organizations were twice as likely to exceed their profitability, market-share, and productivity goals. Start there, then add the flow metrics that explain why the keys move:
| Metric | Question it answers | Source system |
|---|---|---|
| Lead time / cycle time by stage | How long, and which stage eats it | Git + PR events |
| PR pickup time | How long finished work waits for a first review | PR events |
| Deployment frequency | How often value actually lands | CI / deploy events |
| Change failure rate | How often shipping breaks something | Deploys + incidents |
| WIP count and age | How much is in flight, and what's quietly dying | Board + branches |
| Rework / reopen rate | What came back after "done" | Tickets + commits |
That's six. The full map of what each predicts and hides lives in our delivery-metrics guide, but you do not need more than this to start.
Step 2: wire the sources, and trust them in the right order
Not all timestamps are equally honest.
- Git and PR events are the backbone. Commits, review requests, first review, merge: all recorded by machines as a side effect of work. Nobody backfills a
reviewed_attimestamp to look good. - Ticket data is only as honest as the board. Status transitions are human-driven, which means "In Progress" can mean "abandoned in May." Ticket-derived metrics are worth having (they're the only view of pre-code waiting) but read them through your ticket hygiene first.
- Deploy data requires honesty about observability. If you can't reliably see production deploys, say so on the chart rather than quoting a deployment frequency you can't actually observe. A number with an undisclosed blind spot is worse than no number.
The practical wiring order: PRs first (a week of value, near-zero effort), tickets second, deploys/incidents third.
Step 3: baseline against your history first, published bands second
A metric without a reference is a Rorschach test. You need two references, and they must stay visually distinct:
Your own trailing percentiles. Compute p50 and p75 over the last 8-12 weeks. Percentiles, not averages: delivery times are long-tailed, and one stuck PR shouldn't move your whole baseline. The question that matters week to week is are we improving against ourselves.
Published bands, labeled as reference. LinearB's benchmarks (8.1M+ PRs, p75) band pickup time from under an hour (elite) to over 16 hours (needs focus), and cycle time from under 25 hours (elite) to over 161 hours (needs focus). DORA 2024 put elite lead time under a day and low performers at one to six months. These tell you what the published landscape looks like. Definitions differ tool to tool, so treat them as a map reference with an ≈ on it rather than a target with your bonus attached.
Step 4: give the numbers a cadence, or they're wallpaper
Metrics nobody reviews on a schedule decay into wallpaper within a month. Three rhythms cover it:
- Weekly, team level: fifteen minutes on the trends. Anything that moved becomes a candidate topic. This is exactly the feed that makes retrospectives concrete instead of vibe-based.
- Per cycle, planning level: your trailing throughput is the honest input to how much to plan next cycle; history beats aspiration.
- Monthly, leadership level: three or four trended metrics with judgment attached, feeding the report your executives actually read.
One rule binds all three: every review ends with at most one change, and the next review checks whether it worked. Tracking without that loop is theater - the feature-factory pattern with better fonts. The payoff for closing the loop is real: DORA's 2023 report found teams with faster code review report ~50% higher software delivery performance, and "make review faster" is precisely the kind of fix a tracked queue hands you.
The mistakes that kill delivery tracking
- Per-person metrics. Commit counts and ticket tallies per engineer don't predict delivery and destroy trust in the whole system the day they're discovered. The case against individual output metrics is long; the short version is track the queues and leave the humans out of it.
- Averages. A 3-day average pickup time can hide a p90 of two weeks. Long tails are where your delivery actually dies.
- The 40-chart dashboard. Every chart nobody can act on subtracts attention from the six that matter.
- Definition drift. If "cycle time" starts at first commit this month and at ticket-start next month, your trend is fiction. Write the definitions down once.
- Collecting without deciding. The metric's job is to pick your next experiment. If three months of tracking has changed nothing about how you work, you have a very accurate diary.
The build-vs-buy moment
Everything above is buildable in-house: a script over the GitHub API, a cron job, a spreadsheet. Teams do it. Then the script needs stage-splitting, then identity-merging across git handles, then ticket integration, then someone maintains it forever. That's a real cost with a build-vs-buy calculation of its own.
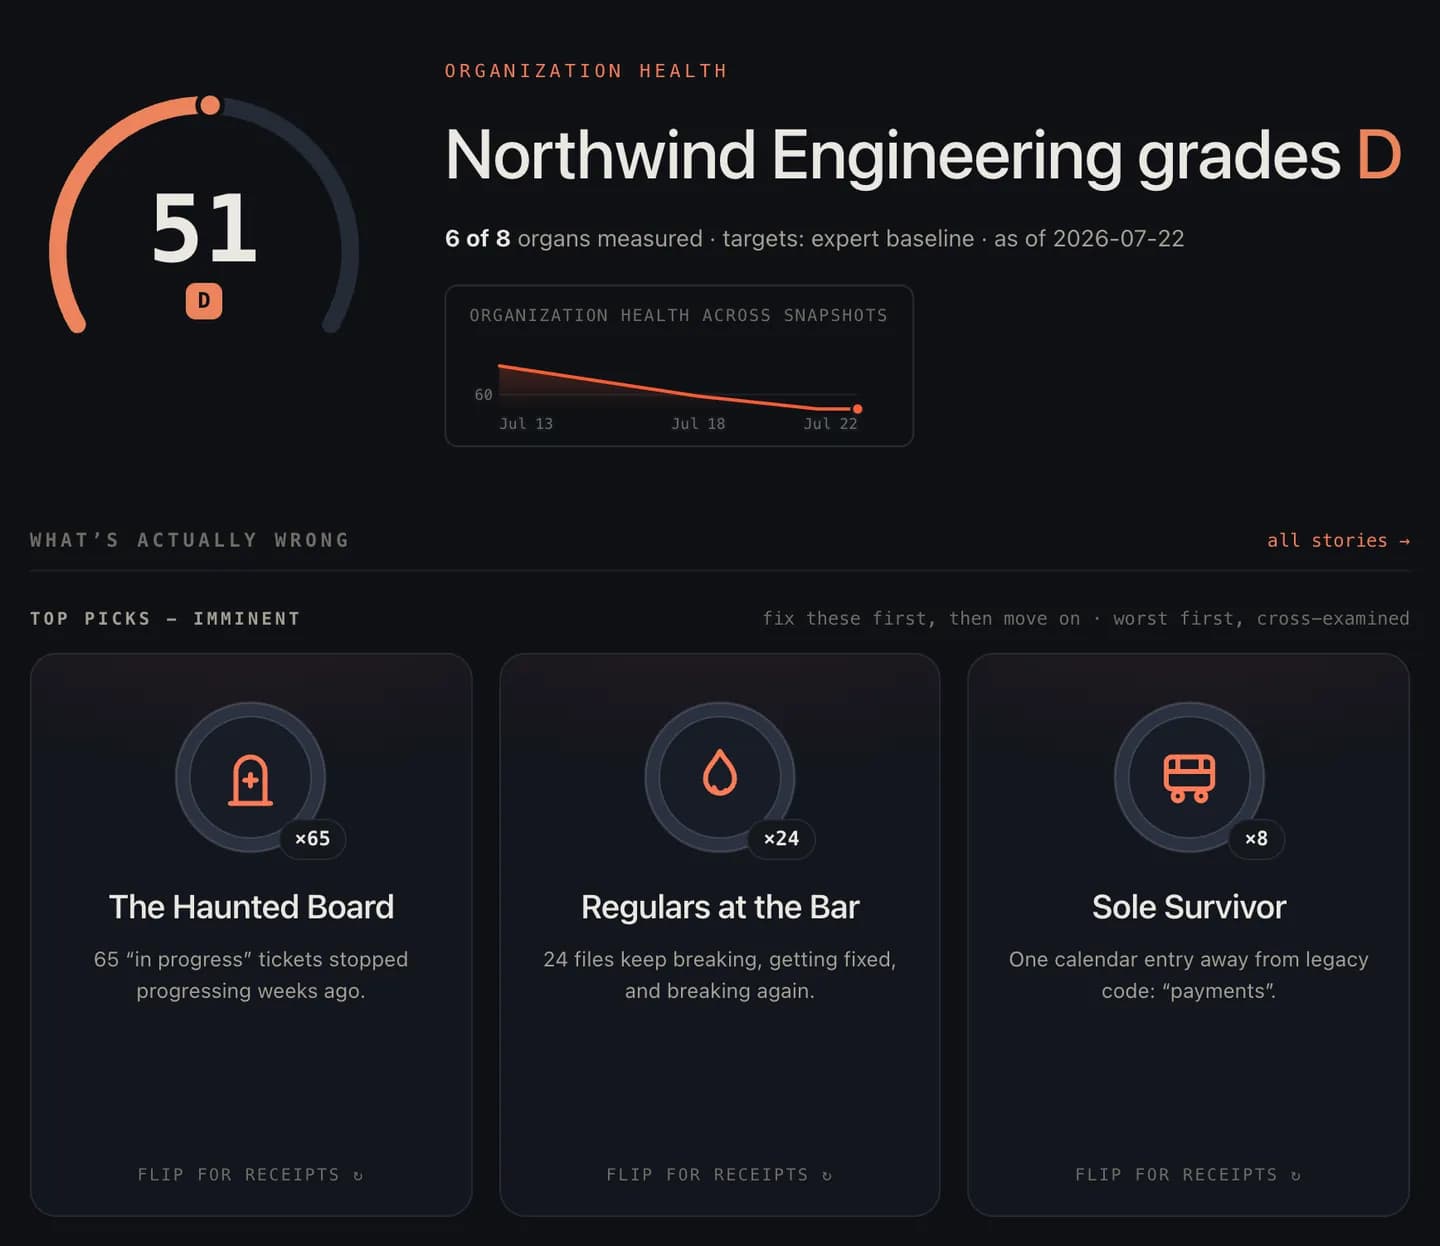
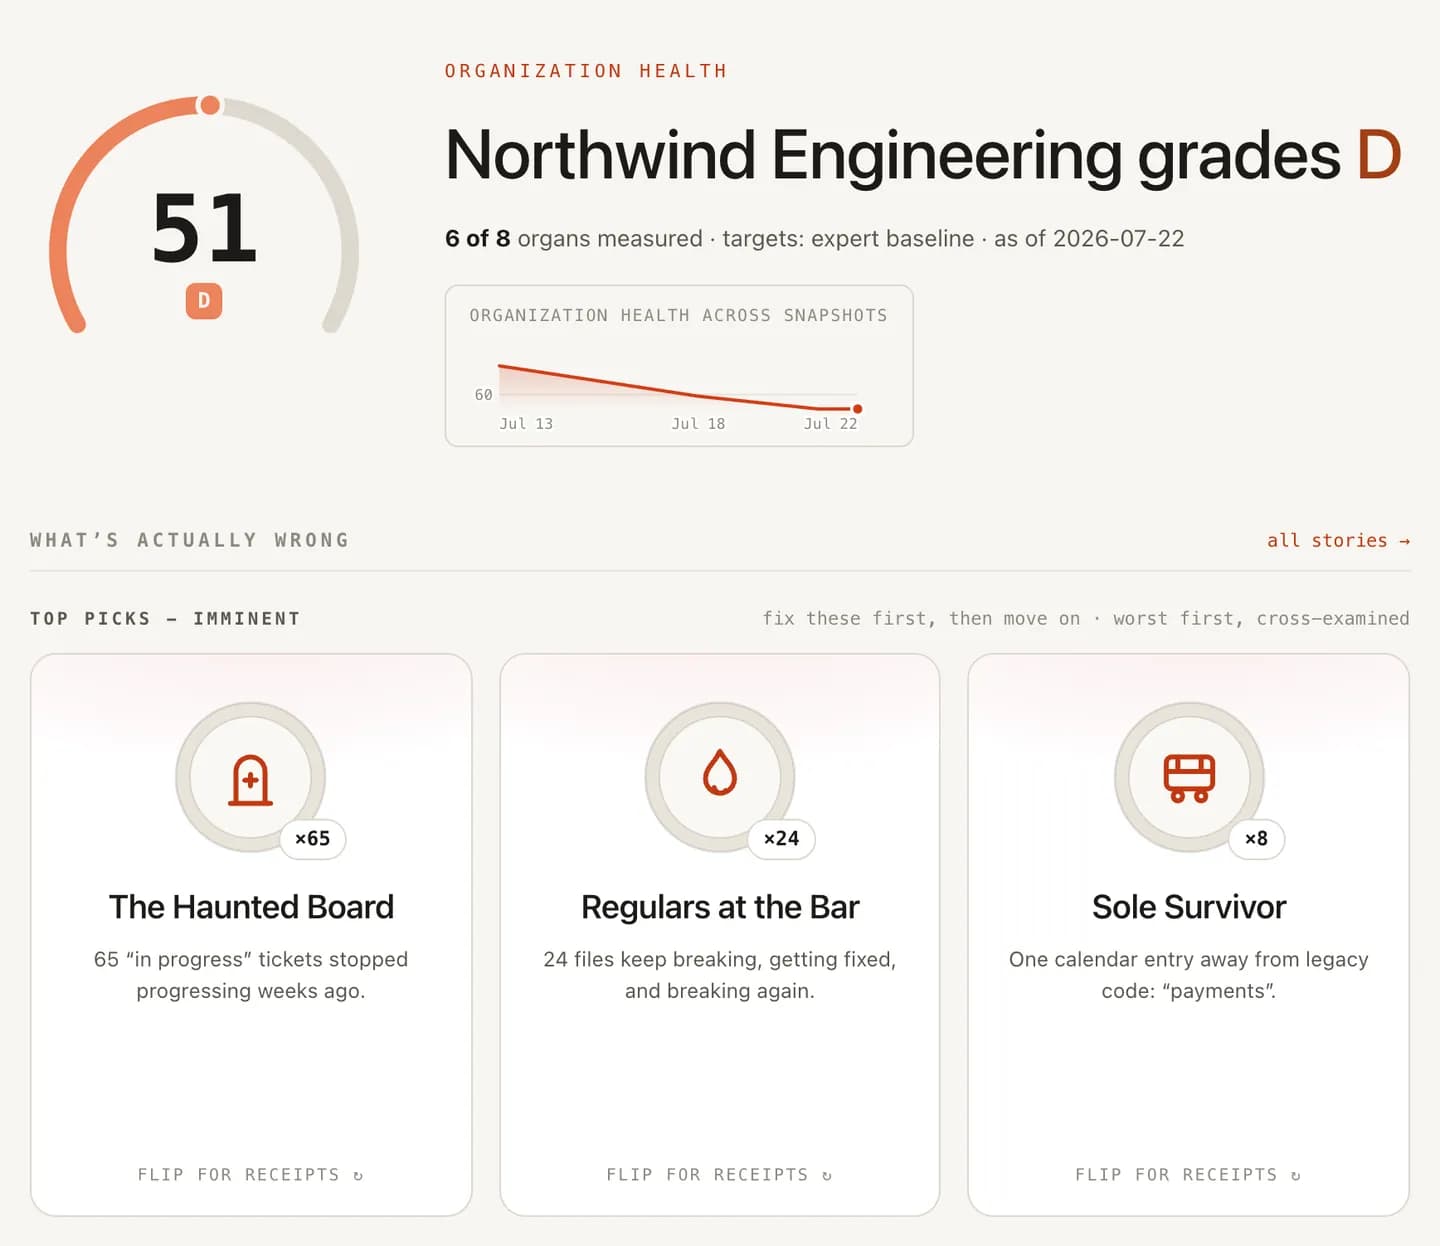
This is the product category Busfactor sits in, so here is the explicit pitch: connect GitHub (and optionally Jira/Linear, Slack, CI) and the whole setup above exists by the afternoon. Cycle-time anatomy split by stage per org, team, and person; pickup queues; stuck and zombie work; ticket loops and board-vs-git drift; DORA with an observability disclosure on every number instead of a quoted deploy frequency it can't see.
Every metric is judged against expert bands for your org's size, with the published references (LinearB, DORA) rendered as cited reference lines (source, year, and an ≈ where definitions differ), never dressed up as your peers. And it's deterministic: same history in, same numbers out, so a figure you quote Monday is the same figure Friday.
The honest limits: it reads your history, so week one starts with whatever your repos and boards contain, including the hygiene problems, which it will name. Ticket-derived metrics inherit your board's honesty (it audits that too, but it can't invent timestamps that were never recorded). And it tells you what and where with receipts. The why, and the change you make about it, is still your meeting. Which is exactly how tracking delivery is supposed to work: the tool finds where the weeks die; you decide what to do about it.
Frequently asked
How do you track software delivery?
Capture timestamps from the systems where work already happens (commits, pull-request events, ticket transitions, deploys) and roll them into a small set of trended metrics: cycle time split by stage, PR pickup time, throughput, work-in-progress age, and rework. Baseline against your own trailing history, review the trends on a fixed cadence, and change one thing at a time. No new process for engineers, no self-reporting.
What metrics should you use to track delivery?
Start with the four DORA keys (lead time, deployment frequency, change failure rate, recovery time) plus the flow metrics underneath them: cycle-time stage breakdown, PR pickup time, WIP age, and rework rate. That is enough to answer the four questions that matter: what shipped, how long it takes, where it waits, and what came back broken. Resist adding more until you have acted on these.
How do you baseline delivery metrics?
Two references, clearly separated. First, your own trailing percentiles (p50 and p75 over the last eight to twelve weeks), because the honest question is whether you are getting better. Second, published industry bands (DORA tiers, LinearB benchmarks) as a labeled external reference, never as a target: definitions differ, and the published numbers describe other people's pipelines.
Should you track individual developer output?
No. Per-person commit counts, ticket tallies, and lines of code do not predict delivery and reliably poison the data the moment people know they are watched. Track the system: queues, stages, batch sizes. Person-level views belong in coaching conversations with context, not on a tracking dashboard.