The Engineering Metrics That Actually Predict Delivery
THE ONES THAT PREDICT
The four DORA keys plus the flow metrics under them - what each predicts, what each hides, and how to read delivery metrics without dashboard theater.
Flat and well above the elite reference - a signal, not a verdict.
Illustrative example
TL;DR: Four metrics predict software delivery: deployment frequency, lead time for changes, change failure rate, and failed-deployment recovery time. Those are the DORA keys. Underneath them sits the flow that actually produces those numbers: coding, pickup, review, merge, deploy. Read them as a system, in percentiles, speed paired with stability. And never promote any single one to a target, because every one of them is gameable alone.
Engineering metrics fail in two directions. Some teams measure nothing and navigate by vibes; the loudest anecdote in the retro becomes the quarter's priority. Others measure everything, wire forty charts into a dashboard, and navigate by whichever line moved last week. Both end in the same place: nobody can answer the only question that matters, which is "if we changed one thing to ship better, what would it be?"
A small set of metrics answers that question. This is the map of them: what each one predicts, what each one hides, and where the others in this series go deeper.
Why measure delivery at all?
Because delivery performance is one of the better-evidenced predictors of business outcomes we have in software. The Accelerate research, the multi-year State of DevOps program that became the DORA reports, found that high-performing delivery organizations were twice as likely to exceed their profitability, market-share, and productivity goals. Shipping ability isn't the whole business, but it's upstream of most of it: a team that can deliver a change safely in a day runs experiments a slow team can't afford to start.
The other reason is defensive. Without real numbers, delivery debates are decided by anecdote seniority. "Reviews feel slow" and "reviews are fine" are both feelings; a queue with a measured median is a fact you can act on.
The four metrics that predict delivery
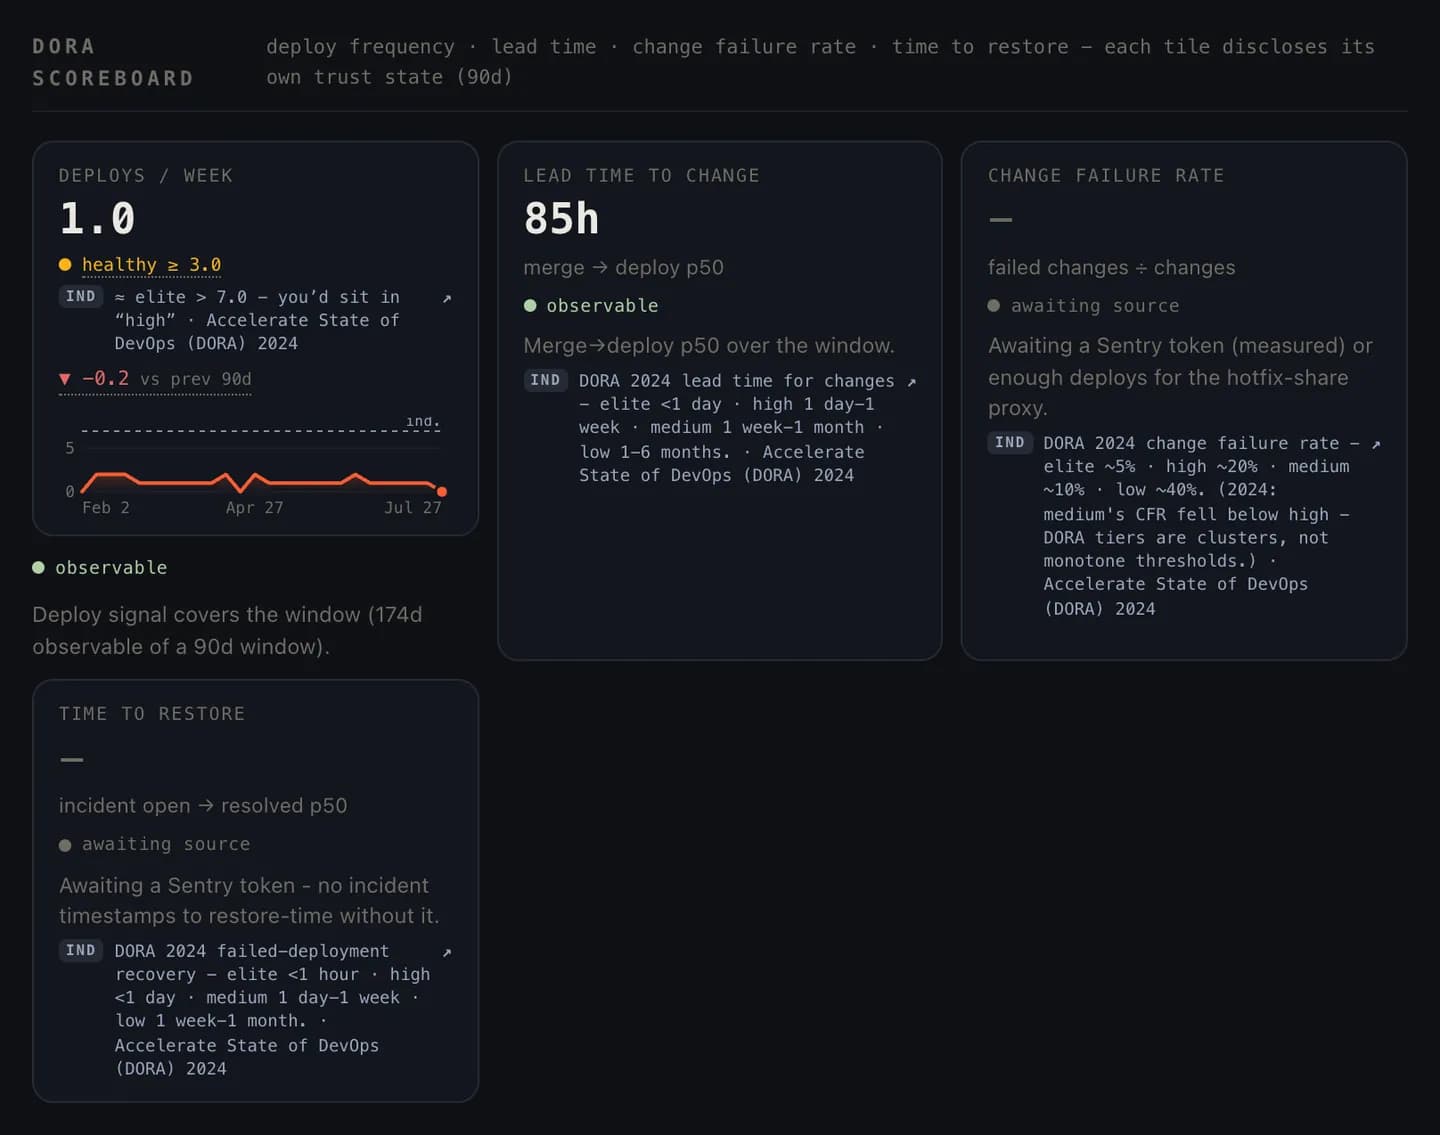
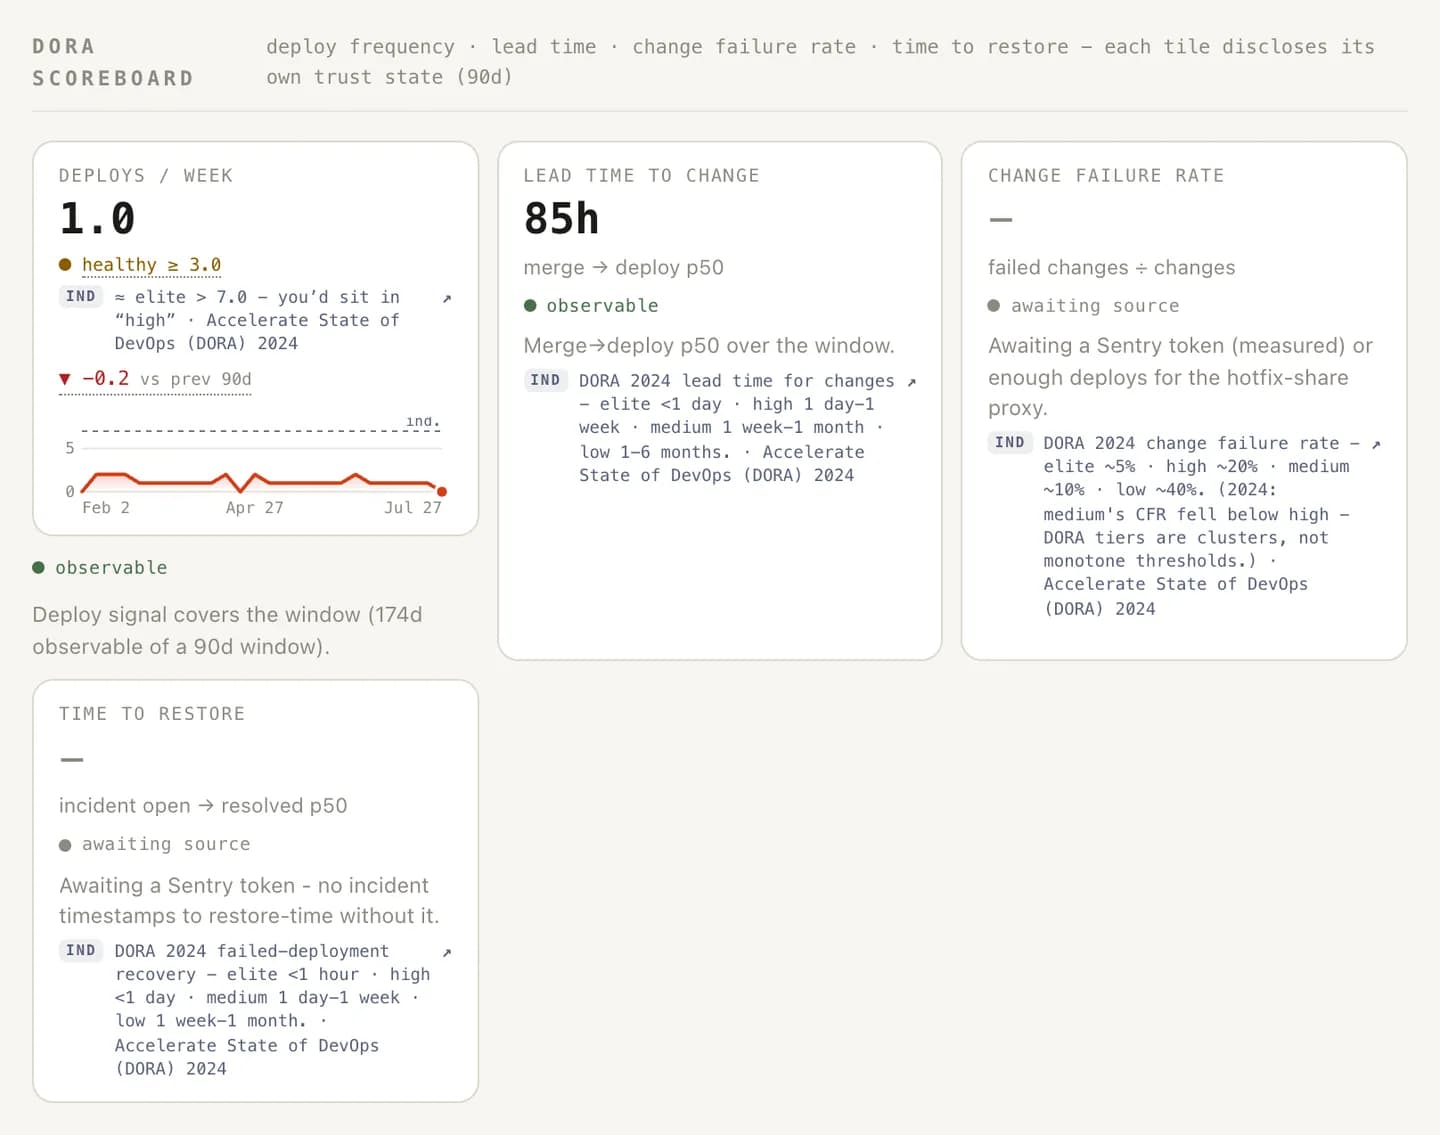
The DORA research program spent a decade converging on four "keys," two about speed and two about stability:
| Metric | Measures | Axis |
|---|---|---|
| Deployment frequency | How often you ship to production | Speed |
| Lead time for changes | Commit → running in production | Speed |
| Change failure rate | Share of deployments causing a failure | Stability |
| Failed-deployment recovery time | How fast you recover when one does | Stability |
The design is the insight. Any speed metric alone is a recklessness meter: you can double deployment frequency by shipping garbage twice as often. Any stability metric alone is a cowardice meter: a 0% change failure rate is trivially available to a team that never ships. The four keys only mean something as a pair of pairs. DORA's finding across a decade of reports is that the best teams don't trade one axis for the other; they get both, because the same practices (small batches, fast feedback, good tests) drive both.
The bands themselves, what "elite" versus "low" actually looks like and the caveats that come with the labels, get the full treatment in DORA metrics explained. The headline version: elite teams deploy on demand and recover from a failed deploy in under an hour; low performers ship somewhere between monthly and twice a year, and take a week to a month to recover.
The flow metrics underneath
The four keys are outcomes. You can't stand in front of a team and say "deploy more frequently" any more than a football coach can say "score more goals." The levers live one layer down, in the flow that produces those outcomes, and that layer has its own better-instrumented metrics:
- Cycle time: how long a unit of work takes from first commit to production, and its near-twin lead time, which sounds identical and isn't. The definitional mess between them is worth twenty minutes of your life, because each one hides a different failure mode: cycle time vs lead time.
- Pickup time: how long a finished PR waits before anyone looks at it. In most teams this is the widest slice of cycle time and the least examined. It's also the cheapest to fix, because cutting the waiting costs nothing while cutting the reading costs quality. The case: PR pickup time.
- Review time: the actual back-and-forth, which mostly goes wrong through batch size. The research here is unusually consistent: reviewers are effective on small diffs and scroll past big ones. The playbook: how to reduce PR review time.
- PR size: the quiet variable driving all of the above. LinearB's 2026 benchmarks - 8.1 million+ PRs across 4,800+ teams - put elite teams under 100 changed lines per PR, and their elite cycle time under 25 hours (measured first commit to production, at p75). Small batches get picked up sooner, reviewed properly, and fail smaller.
These aren't competing frameworks. Deployment frequency, the topic of its own deep-dive, is essentially the inverse of batch size, and batch size is set by how you slice PRs. The four keys are the scoreboard; flow metrics are the game tape.
What delivery metrics hide
This is the section the vendor decks skip, so let's be adults about it.
Every one of these is gameable, and Goodhart's law is undefeated. Make deployment frequency a target and you'll get no-op deploys. Make cycle time a target and work will be split into tickets so small they're bookkeeping. The metrics are diagnostic instruments; nobody should get paid on them. The moment a number becomes a goal, treat its improvement as unverified until the underlying behavior confirms it.
Averages lie; distributions don't. A team with a 20-hour average cycle time can be a healthy team - or a team where half the PRs merge in 2 hours and a long tail rots for two weeks. The tail is where the risk lives (that's where the expensive stuck reviews hide). Look at medians and p75/p90, never the mean alone.
Speed metrics without stability metrics select for recklessness, and the reverse selects for paralysis. The 2023 DORA report found teams with faster code review show 50% higher software delivery performance, but the same research tradition is equally clear that throughput without stability is just deferred incident response.
None of them measure whether you built the right thing. A team can be elite on all four keys while efficiently shipping features nobody asked for. Delivery metrics measure the pipe, not the water.
Per-person delivery metrics are a category error. Cycle time is a property of queues, pipelines, and review culture, none of which an individual controls. Rank people by it and you'll learn who got assigned the gnarly migration, and then you'll learn what creative ticket-splitting looks like.

How to actually use them
- Start with the four keys as a scoreboard. Orient on the published bands, honestly, without cherry-picking the metric you're best at.
- Decompose cycle time by stage. Coding, pickup, review, merge, deploy. Find the widest slice; it is usually waiting.
- Fix the constraint, not the metric. If pickup is the problem, make the queue move. If review is the problem, shrink the PRs. If deploys are the problem, look at batch size and pipeline.
- Watch trends. A single week's number is noise; a six-week slope is signal.
- Re-measure and say so out loud. The team that hears "pickup time halved since we changed the review agreement" learns that measurement is for improvement. That credibility is the entire foundation the next fix stands on.
Delivery metrics won't tell you what to build, and they won't manage your people for you. What they will do, used honestly, in percentiles, speed paired with stability, is end the era of navigating a million-euro engineering budget by whoever tells the best story in the retro. That trade is worth making.
Frequently asked
What are the four key software delivery metrics?
The DORA 'four keys': deployment frequency, lead time for changes, change failure rate, and failed-deployment recovery time. Two measure speed, two measure stability, and a decade of DORA research shows the best teams score well on both at once, not one at the expense of the other.
Should delivery metrics be measured per developer?
No. Delivery metrics describe a system (queues, batch sizes, pipelines, review habits), not individual effort. Per-person delivery numbers reliably measure who works on which kind of task, then get gamed. Measure the system; coach the people.
Which delivery metric should we fix first?
Decompose cycle time by stage and fix the widest slice. For most teams that's waiting, a PR sitting unpicked before review, which is also the cheapest stage to fix: nobody has to work faster, the queue just has to move.