Build Your Own Metrics Dashboard vs Buying One
BUILD IT OR BUY IT?
The honest math on building an engineering metrics dashboard versus buying one: what DIY really costs, when scripts win, and when a tool earns its keep.
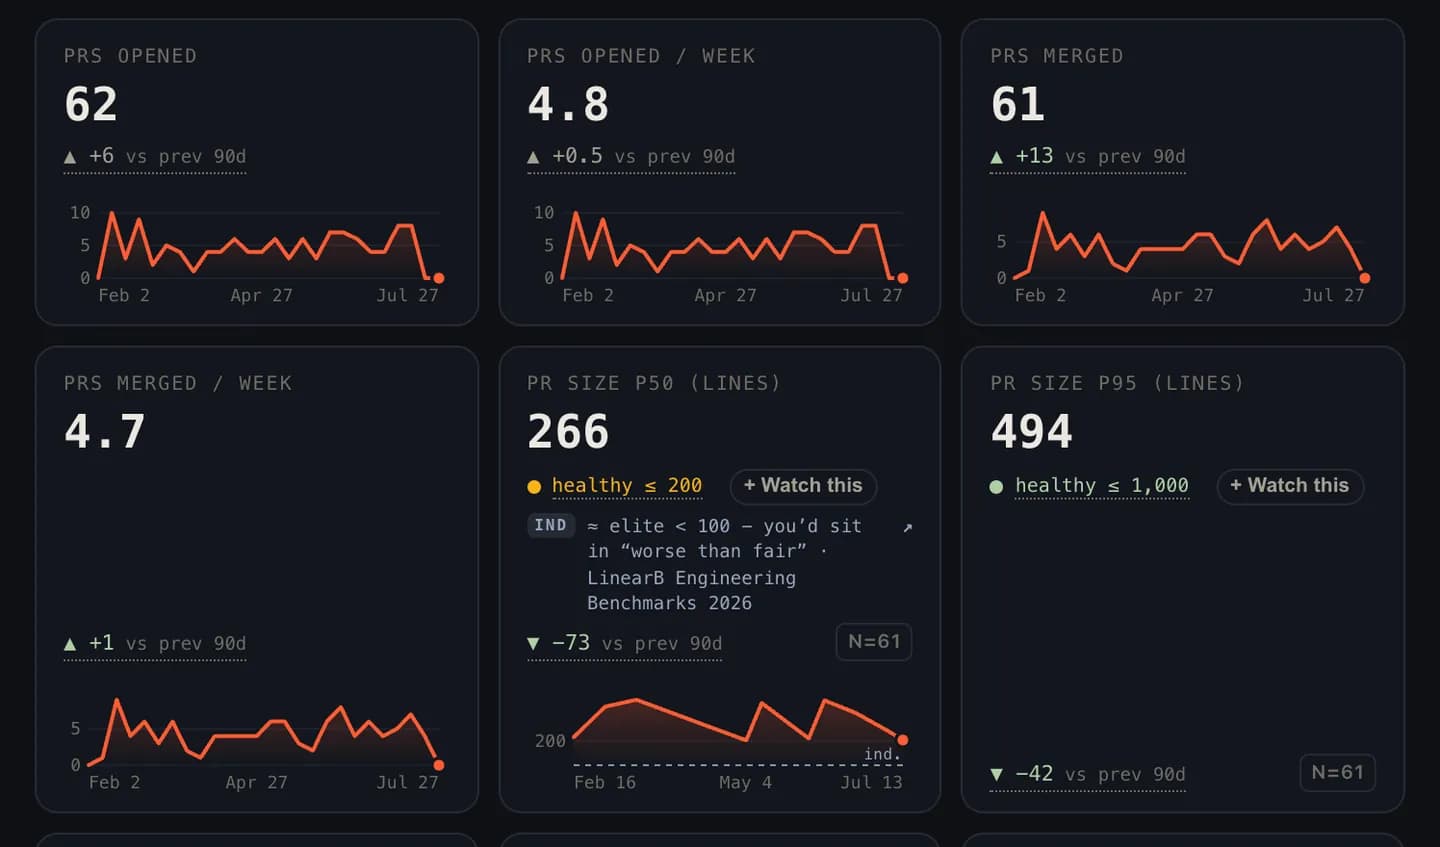
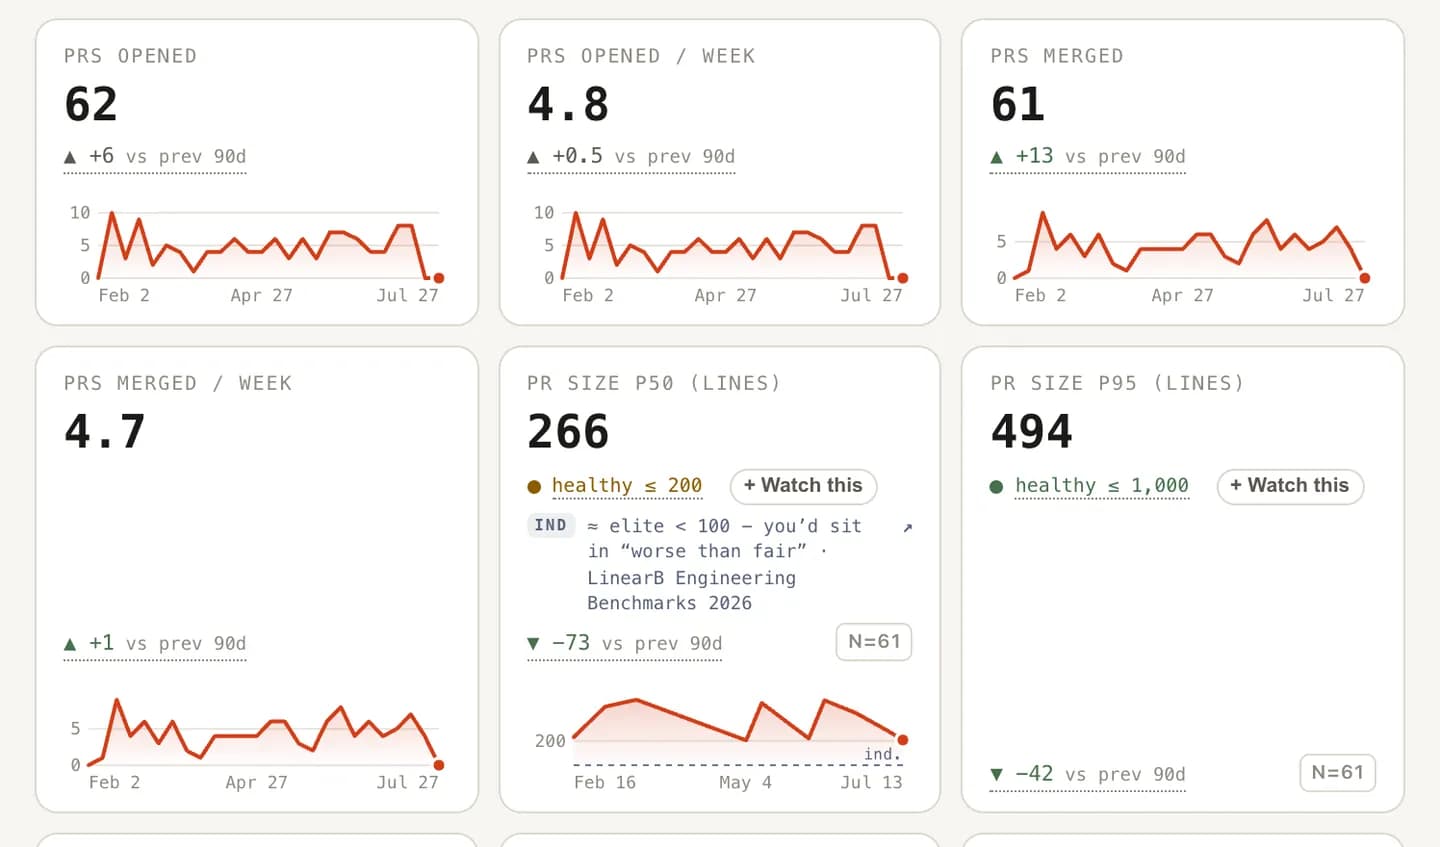
The band we grade against.
Illustrative example
TL;DR: Yes, your best engineer could build a metrics dashboard in a weekend. The weekend version will also be wrong in ways nobody notices until it's quoted in a board deck. Build when you have one question, clean data, and someone who genuinely wants to own it; buy when you have recurring questions across sources, multiple teams that need to trust one set of definitions, and a payroll that makes engineer-hours your priciest currency. Either way: run the math in loaded cost, not in vibes.
Every conversation about buying engineering analytics eventually produces the sentence "we could build this ourselves." It's usually said by someone excellent. It's usually even true, for a specific, smaller value of "this." What follows is the honest version of the math, from people with an obvious horse in the race. We'll flag the bias and argue with receipts anyway, because a DIY-er who hits the wall later trusts nobody, and a DIY-er who knows the wall's location can make a real decision now.
What building a metrics dashboard actually involves
The weekend version: hit your git host's API, pull PR timestamps, compute averages, chart them. Genuinely a weekend, genuinely useful, and if one metric is all you need, this article ends early - go build it.
The version people think they're getting, though, usually includes the four DORA keys (which need deploy and incident data, not just git), review-flow breakdowns, per-team views, history backfills, and a trend line someone can put in a quarterly review. That version involves:
- Ingestion from at least two systems (git host + tracker or CI), each with rate limits, pagination, webhook gaps, and backfill runs that take longer than the demo suggested.
- A data model that survives renamed repos, moved tickets, and reorganized teams without silently corrupting last quarter's numbers.
- Definitions someone must choose and defend: where does cycle time start and stop? What counts as a deploy? What's a "failure"? Every choice is arguable, and the arguing is a feature of the job.
- Presentation good enough that people other than the author actually look at it. This is the graveyard where most internal dashboards are buried.
The edge cases that eat your weekends
The first version of every DIY dashboard is wrong, and wrong in the same ways. A field guide to the incoming surprises:
- Force pushes and rebases rewrite the history you measured yesterday. Your timestamps and diffs move after the fact; your metrics need a story for that.
- Squash merges collapse authorship and timing into one commit - fine, until half your teams squash and half don't. At that point their numbers stop being comparable.
- Bots. Dependency-update bots and CI accounts can dominate raw PR counts. Forget to filter them and your "review pickup improved" headline is celebrating a robot.
- Identity resolution. One human, three emails, two usernames across systems. Skip this and every per-person and ownership analysis double-counts.
- Timezones. Compute in anything but UTC, once, and enjoy explaining why deploy Friday became deploy Saturday in the Q3 report.
- Reverts and reopens. Shipped isn't done, closed isn't closed, and naive counting reads rework as productivity.
None of these is hard alone. Together they're why the weekend project has a version 0.7 that everyone quietly distrusts by spring.
What DIY really costs
Price it honestly or don't price it at all. The unit is engineer time at fully loaded cost: salary plus benefits, employer taxes, equipment, and overhead. The classic MIT estimate puts loaded cost at roughly 1.25-1.4 times base salary; the full breakdown shows how that compounds. Whatever your senior engineer costs per week, that is the price of every week spent on ingestion plumbing. Not "free, we already pay them."
Then add the part that build-vs-buy math always omits: maintenance is an annuity. API versions change, new repos and teams arrive with new conventions, every edge case above files in as a bug, and each stakeholder who starts relying on the dashboard converts it from side project to production service with an SLA and no headcount. And the cruelest line item: internal tools have a bus factor too. The dashboard's author changes teams, and now you own an unmaintained analytics codebase and need this article again.
Opportunity cost closes the ledger: those same weeks were product work. That trade can still be worth it - but only if someone writes it down and chooses it on purpose.
When building wins
Honesty cuts both ways. Build when:
- You have one question. A deploy counter or a PR-age nag bot is a script, not a platform. Buying a platform to answer one question is how shelfware happens.
- Your context is genuinely weird. Unusual VCS setup, air-gapped environment, or a monorepo arrangement no vendor handles well. Sometimes bespoke is the only correct answer.
- Data can't leave the building. Strict sovereignty requirements can make DIY the only compliant option, in which case the annuity is simply the cost of compliance.
- You have a data team with capacity and appetite. Some orgs treat internal analytics as a product with an owner and a roadmap. If that appetite is real rather than aspirational, it works.
- You're learning. Building a rough version of a metric teaches you its failure modes better than any vendor doc, which is why even orgs that buy should prototype one metric by hand first - if only to sharpen their evaluation questions.
When buying wins
- The questions are recurring and cross-source. Delivery trends, review dynamics, knowledge risk, AI impact - correlated across git, tickets, and CI. Each lane is a build; the correlations are the product.
- Multiple teams need one truth. Definitions, edge-case handling, and benchmark context maintained by someone whose whole job it is beats a spreadsheet argument every quarter.
- It has to survive its author. A vendor's roadmap doesn't resign.
- Engineer time is the scarce resource. At loaded cost, a senior engineer maintaining ingestion plumbing is very expensive hosting for a chart.
The decision in five questions
- How many distinct questions do we need answered: one, or a growing list?
- Who owns the DIY version in 18 months, and do they know that?
- What's the loaded-cost price of the build and the annuity, written down?
- Do multiple teams need to trust the same definitions?
- Did we price the failure mode - a dashboard nobody trusts - at zero? (It isn't.)
If the answers cluster around "one question, willing owner, weird constraints," build, with our blessing and a UTC-only commandment. If they cluster around "many questions, no owner, expensive engineers," evaluate tools like an engineer: the buyer's guide and the question checklist are the door.
Frequently asked
Can I build my own DORA metrics dashboard?
Yes - the four keys are computable from data you already have: deployment events, commit and PR timestamps, and incident or failure records. A first version against one repo with clean deploy conventions is a genuinely reasonable internal project. The honest caveats are scope (multi-repo, multi-team normalization) and maintenance (APIs change, edge cases accumulate, the maintainer changes jobs).
How much does it cost to build an internal metrics dashboard?
Price it in engineer time at fully loaded cost - salary plus benefits, employer taxes, and overhead, which MIT's classic estimate puts at roughly 1.25 to 1.4 times base salary. Then price the part everyone forgets: maintenance is a permanent annuity, not a one-off, because every data-source API change, new repo, and edge case lands on your build forever.
When does buying an engineering metrics tool make sense?
When the questions outgrow one metric: when you need review dynamics, knowledge-risk mapping, and cross-source correlation rather than a deploy counter; when more than one team needs to trust the same definitions; and when the engineers who'd maintain the DIY version have a backlog of actual product work - which, at fully loaded cost, is usually the most expensive dashboard-hosting arrangement in the company.