Change Failure Rate: Honest Measurement, No Theater
MEDIUM BEAT HIGH
What change failure rate actually measures, the real DORA 2024 bands - including the medium-beats-high anomaly - and how teams game it without noticing.
A late-night pattern midweek - worth a conversation, not a scorecard.
Illustrative example
TL;DR: Change failure rate is the share of production deployments that need remediation: rollback, hotfix, patch. The 2024 DORA bands: elite ~5%, high ~20%, medium ~10%, low ~40%. No, that ordering isn't a typo, and the anomaly is exactly why the bands are orientation rather than law. CFR is the easiest DORA key to fake, because both its numerator and denominator are definitional choices. The honest version: define "failure" as a remediation event you can point to in your deploy and git history, publish the definition, quote the denominator, and never make the number a target.
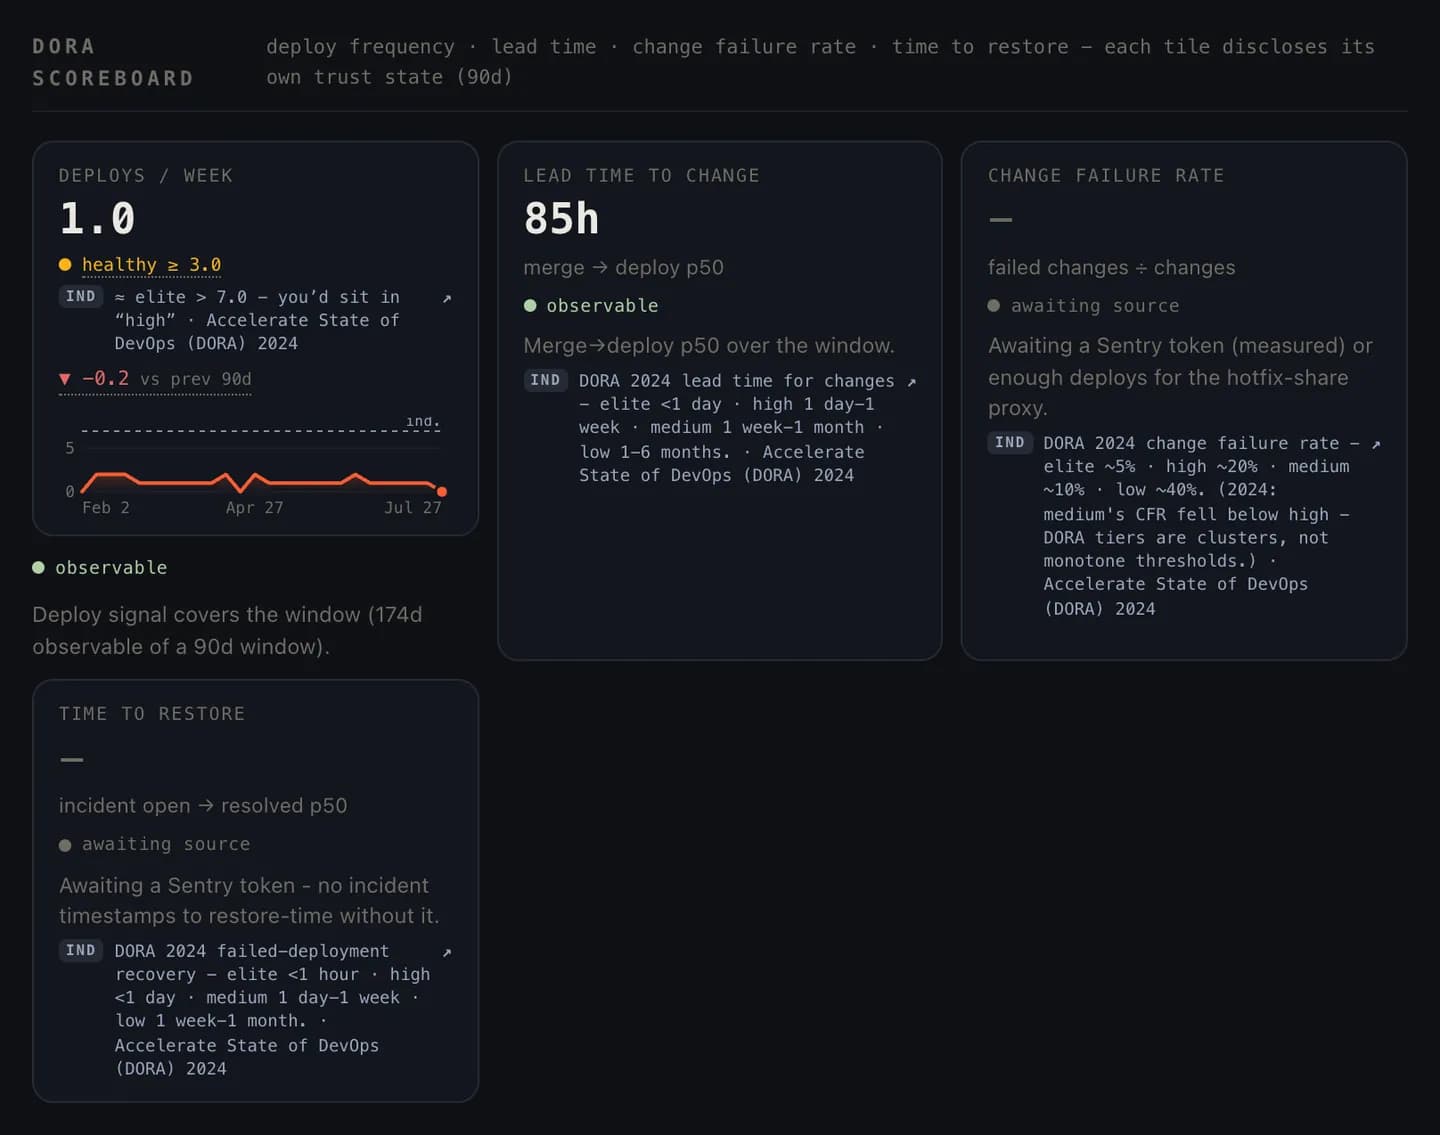
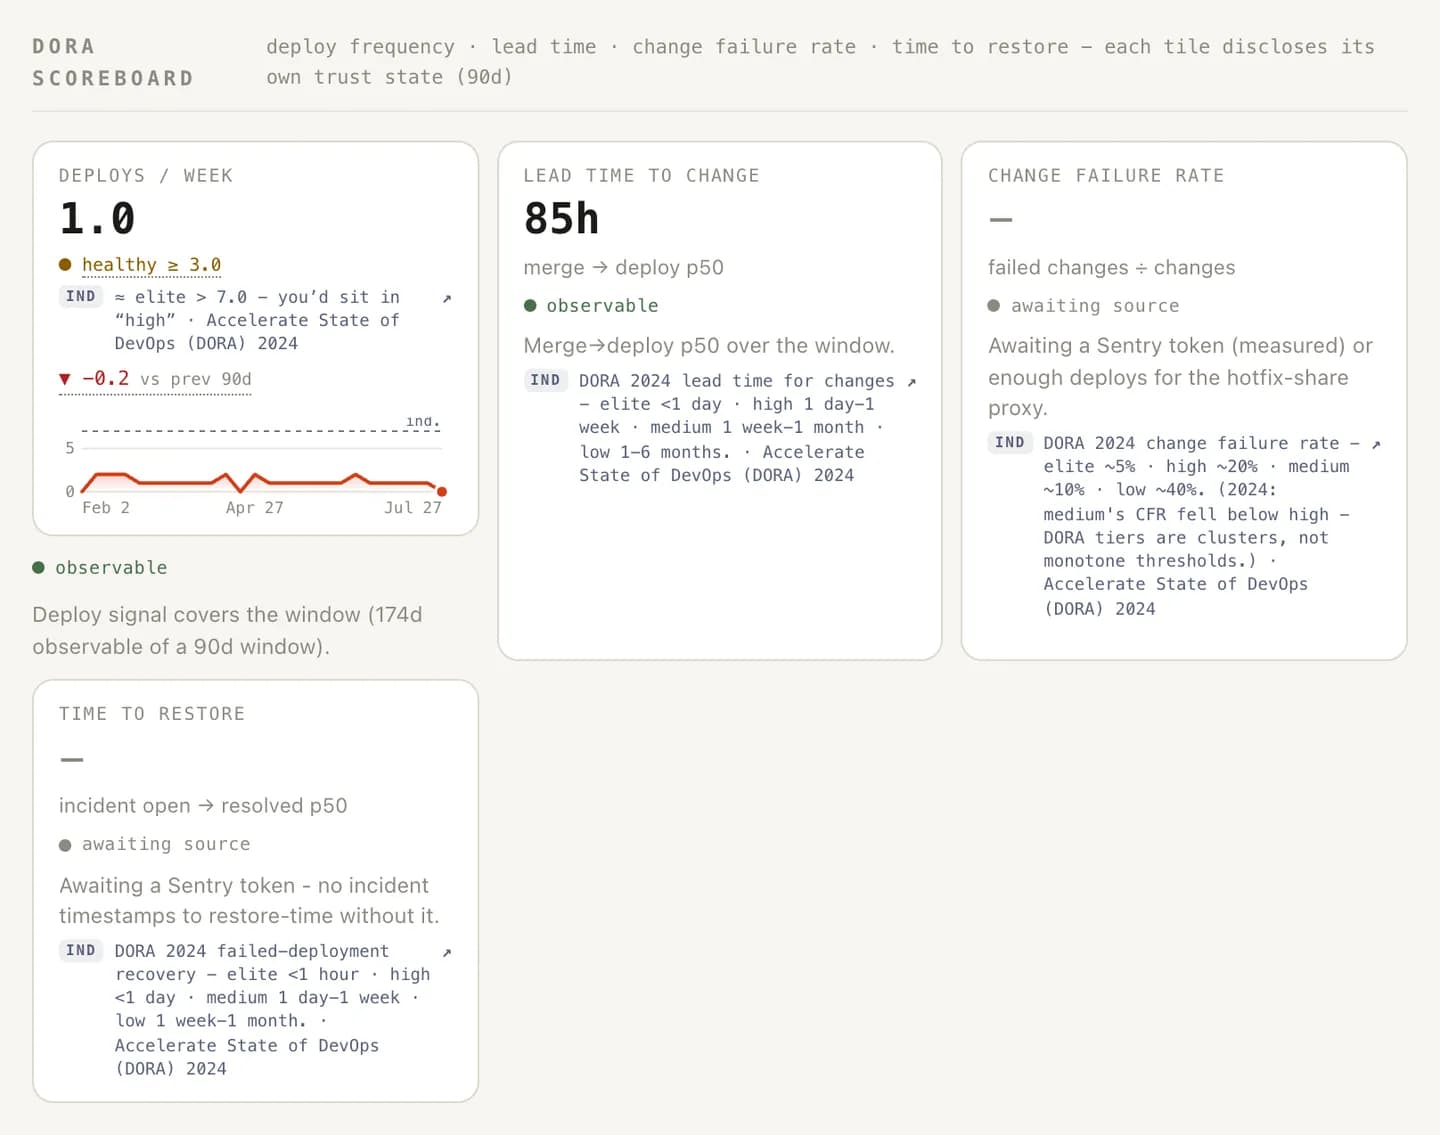
Change failure rate is the only one of the four DORA keys that never got its own article here - an omission worth fixing, because it's the key most often measured dishonestly. Not maliciously. Just… flexibly. And a flexibly measured stability metric is worse than none, because it lets a team ship recklessly while the dashboard applauds.
What is change failure rate?
Change failure rate (CFR) answers one question: when you deploy, how often does it go wrong badly enough that someone has to act? "Act" means remediation: a rollback, a hotfix, an emergency patch, a service restoration. Deployments that land clean don't count. Bugs found in staging don't count. A latent defect nobody has hit yet doesn't count until it does.
Its job in the DORA architecture is to be the chaperone. Deployment frequency and lead time reward going fast; CFR and recovery time make sure "fast" isn't a euphemism for "reckless." The Accelerate research behind the four keys made its name on the claim that this trade-off is false: high performers are fast and stable, and were twice as likely to exceed their profitability, market-share, and productivity goals. The claim only holds if the stability half is measured as honestly as the speed half.
Speed is easy to measure honestly; your deploy log doesn't negotiate. Failure is where the negotiating happens.
Calculating it, and where the calculation hides the decisions
The formula is trivial:
CFR = deployments causing a failure ÷ total deployments, over a window.
Every hard decision hides in the words:
- What counts as a deployment? Use your deploy log - production deploys only. If you batch ten changes into one release train, that's one deployment, and one bad change poisons the batch. (This is one of several reasons small, frequent deployments flatter your CFR honestly: smaller blast radius per deploy.)
- What counts as a failure? Pick a definition you can point to in a system: a rollback executed, a hotfix deployed, a revert merged, an incident whose cause was a deploy. Remediation events, not vibes. If your definition requires a human to decide after the fact whether something "really" counted, your CFR is an opinion wearing a percentage sign.
- What window? Long enough to be stable. A team deploying ten times a month moves its CFR by ten points with a single bad deploy, so quote the denominator every time ("2 of 41 deploys," not "4.9%"). A percentage without a denominator is how small teams end up panicking over noise.
What is a good change failure rate?
The 2024 DORA report - the final year the elite/high/medium/low tiers were published - reported:
| Cluster | Change failure rate |
|---|---|
| Elite | ~5% |
| High | ~20% |
| Medium | ~10% |
| Low | ~40% |
Read the middle rows again. The medium cluster reported a lower failure rate than the high cluster. That is no error. It's the clearest evidence in the whole table that DORA's tiers are k-means clusters over survey data rather than four rungs of a ladder, and a cluster can be slower and cleaner than the one "above" it.
The 2025 report retired the tier model entirely in favor of seven team archetypes, so the 2024 table is the last of its kind. Use it to orient, never to certify.
The honest takeaway from the bands is not "get to 5%." Somewhere between one-in-twenty and one-in-three of the industry's deployments need remediation, and where you sit in that range is mostly determined by batch size, review quality, and test feedback. All three are yours to change before deploy day; heroics on the day itself barely move it.
How teams game change failure rate
Every gaming vector is a definitional choice left un-nailed-down. The four favorites:
- Shipping less. Refuse the risky work, defer the migration, let the scary change age in a branch - CFR improves while the product stalls. This is why CFR must always be read next to deployment frequency: infinite stability is available to teams that never ship.
- Reclassifying failures. "That wasn't a failure, that was a fast-follow." If fixing forward within the hour doesn't count as remediation, your CFR measures your team's vocabulary.
- Inflating the denominator. No-op deploys, config-only deploys, deploys split for the dashboard's benefit. The number falls; nothing improved.
- Severity laundering. Remediate quietly - a revert commit with an innocent message, no incident record - and the numerator never hears about it. This one is usually not even deliberate; it's what happens when recording a failure feels like filing a confession. Blameless remediation records are a data-quality requirement.
CFR theater is almost never lying. It's definition drift under incentive, which is also the fix: write the definition down, derive both numerator and denominator from systems (deploy log, revert commits, hotfix tags), and never attach anyone's bonus to the result.
How to reduce change failure rate (actually)
The levers, in rough order of return:
- Shrink the batch. Small changes are easier to review, easier to test, and vastly easier to roll back. The SmartBear/Cisco research found reviews catch 70-90% of defects when done well, and "done well" collapses beyond a few hundred lines at a time. Small pull requests are a stability practice that gets filed under productivity.
- Make review coverage real. A deploy that sailed through un-reviewed, or rubber-stamped in ninety seconds, carries its full defect load to production. Review is your cheapest pre-production failure filter.
- Watch rework too. Your rework rate (recent code rewritten or reverted) is CFR's leading indicator. Rework that never reaches production still tells you the same story about batch size and clarity, earlier and cheaper. When the rework keeps landing in the same handful of files, the question stops being about the files and starts being about ownership. That is hotfix rate territory.
- Decouple deploy from release. Feature flags and progressive rollout mean a bad change degrades one cohort while remediation stays a toggle. No war room.
- Record every remediation, blamelessly. The team that writes down all of its failures will report a worse CFR than the team that hides half of them, and will be the only one of the two that improves.
CFR is a good metric with terrible defaults. Nailed to system-derived events and read alongside its three siblings on the delivery scoreboard, it tells you whether your speed is real. Left as a self-reported vibe, it tells you only how your team feels about admitting things - and you already knew that.
Frequently asked
What is change failure rate?
Change failure rate (CFR) is the share of deployments to production that cause a failure needing remediation: a rollback, hotfix, or emergency patch. It's one of the four DORA keys and one of the two stability metrics, designed to keep the speed metrics honest.
What is a good change failure rate?
In DORA's 2024 report (the final year tiers were published) elite teams reported around 5%, high around 20%, medium around 10%, and low around 40%. Yes, medium beat high: the tiers are survey clusters, not ordered grades, so treat the bands as orientation rather than thresholds.
How is change failure rate different from rework rate?
CFR counts deployments that failed in production and needed remediation. Rework rate counts recently written code that gets rewritten or reverted, whether or not it ever caused a production failure. CFR is the bill that arrives publicly; rework is the same debt paid quietly in the editor.
Can a change failure rate be too low?
A very low CFR next to a low deployment frequency is usually a warning, not a trophy. Teams can suppress CFR by refusing to ship anything risky; the number improves while the product stagnates. Always read CFR together with deployment frequency and lead time.