How to Report Engineering Progress to Executives
WHAT EXECS ACTUALLY READ
What to put in an engineering status report executives will actually read: a working template, the few metrics worth trending, and what to leave out.
The band we grade against.
Illustrative example
TL;DR: Executives don't want your dashboard. They want to know four things: is the money turning into shipped product, faster or slower than before, what's at risk, and what you need from them. The report that answers this is one page. Shipped work in business terms with links, three or four trended metrics with judgment attached, a forecast range with a track record, risks and asks, one win. Same format, same day, every month. Leave out story points, per-person numbers, and anything you'd have to caveat into meaninglessness.
Somewhere between "engineering is a black box" and a 40-chart dashboard nobody opens lies the report your executives actually want. Most engineering leaders oscillate between the extremes: say too little and the board fills the silence with suspicion; dump raw metrics and you've delegated the judging to people with the least context to judge. The working format is neither. It's one page, five sections, the same shape every month. The discipline of producing it will improve your engineering org as a side effect, because you can't report honestly on what you don't track.
What do executives actually want to know?
Strip away the format and there are four questions:
- Is the payroll turning into product? Outcomes, with links.
- Are we getting faster or slower? Direction matters more than absolute numbers.
- What's at risk? Surprises are the thing executives are paid to hate.
- What do you need? A report with no ask is a monologue.
There's a reason to take the delivery questions seriously rather than treating them as theater for the board: the research behind Accelerate found high-performing delivery organizations were twice as likely to exceed their profitability, market-share, and productivity goals. Delivery performance is a business variable. Report it like one.
The one-page template
1. Shipped (5-8 bullets). Real, landed work, stated as customer or business impact, each bullet linked to the actual release or PR so "shipped" is verifiable. "Checkout latency cut; conversion team unblocked" beats "completed 34 tickets." If you struggle to fill this section in business language, that's a finding about the roadmap - possibly a feature-factory finding.
2. Delivery health (3-4 metrics, trended, judged). Covered in depth below. The key word is judged: every number carries "improving / flat / degrading" and one sentence of what you're doing about it.
3. Forecast (a range, not a date). "The remaining scope lands mid-October to mid-November at current throughput." A range built from your own delivery history, with last quarter's forecast accuracy noted. A range you hit repeatedly builds more credibility than a confident date you miss once.
4. Risks and asks (2-4 items). Each risk with exposure and mitigation; each ask with a decision needed and a date. This is the section executives can actually do something with. Starve it and the report is a press release.
5. One win. A person or team doing something worth knowing about, framed as praise, no metrics attached. Culture is part of the status.
Which metrics belong in an executive report?
Fewer than you think. Trend them, and attach a judgment to each:
- Lead time: idea to production, split from cycle time deliberately. This is the "are we getting faster" answer.
- Deployment frequency: how often value lands. DORA 2024 gives the published context: elite teams deploy on demand, low performers monthly to twice a year. That's a citable external reference when a board member asks "is weekly good?" (Use published bands as reference, not as peer comparison; definitions differ.)
- Change failure rate: the stability counterweight, so speed never gets reported without its cost.
- One local bottleneck metric: whatever your current constraint is (review pickup, WIP age), included while you're fixing it, retired when it's fixed. It shows the executives the machine is being tuned.
Two rules bind the section. First, same metrics, same definitions, every month. A trend with shifting definitions is fiction, and the consistency is what makes month six more valuable than month one. Second, every number gets a judgment. "Lead time p75: 9 days, degrading - driven by review queue; mitigations below" is a report. A bare "9 days" is homework you've assigned to the CEO. The underlying tracking machinery is the same one from how to track software delivery; the executive report is its monthly rollup.
What to leave out
- Story points and velocity. Planning units, not performance units. They aren't comparable across teams, they inflate under attention, and they invite the one question ("why is Team B slower?") that has no honest answer.
- Per-person anything. Individual metrics in an executive deck are how stack-ranking cultures get born. Report the system; discuss people in 1:1s. The SPACE research is blunt that productivity can't be measured by a single metric - a truth that evaporates the moment a spreadsheet column sorts your engineers.
- Activity counts. Commits, PRs opened, tickets closed. They measure motion, and they're trivially gameable the day they matter.
- Green-shifted status. The report that's all-green until the week it's suddenly red destroys exactly the trust it was trying to buy. Yellow, early, with a mitigation, is what credibility is made of.
- Chart dumps. If a chart doesn't change a decision, it's decoration. Cut it.
How often to report, and the trust mechanics
Monthly for the written report; weekly or per-cycle for a three-line pulse (shipped / on track or not / blockers). Then hold the format ruthlessly stable. The value compounds through consistency: trends only emerge when definitions hold still, and executives learn to trust the report exactly as fast as it proves it doesn't hide things. The cheapest trust-builder in the whole system is the forecast section quietly noting "last quarter we forecast X; actual was Y."
Where Busfactor fits
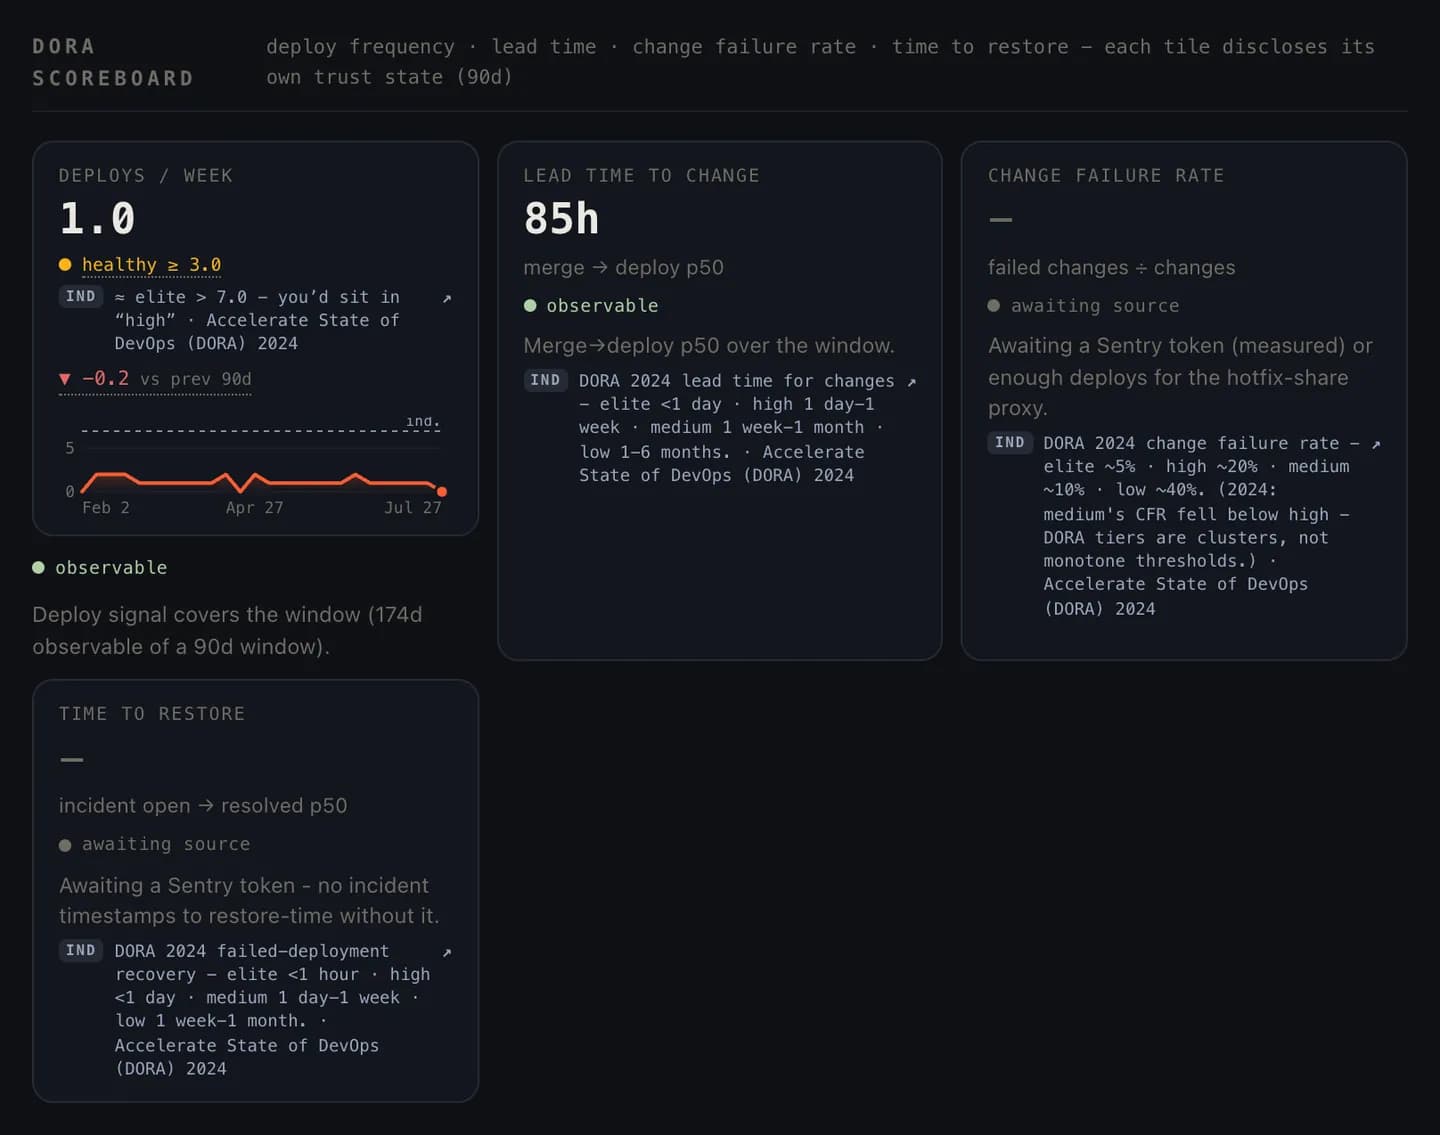
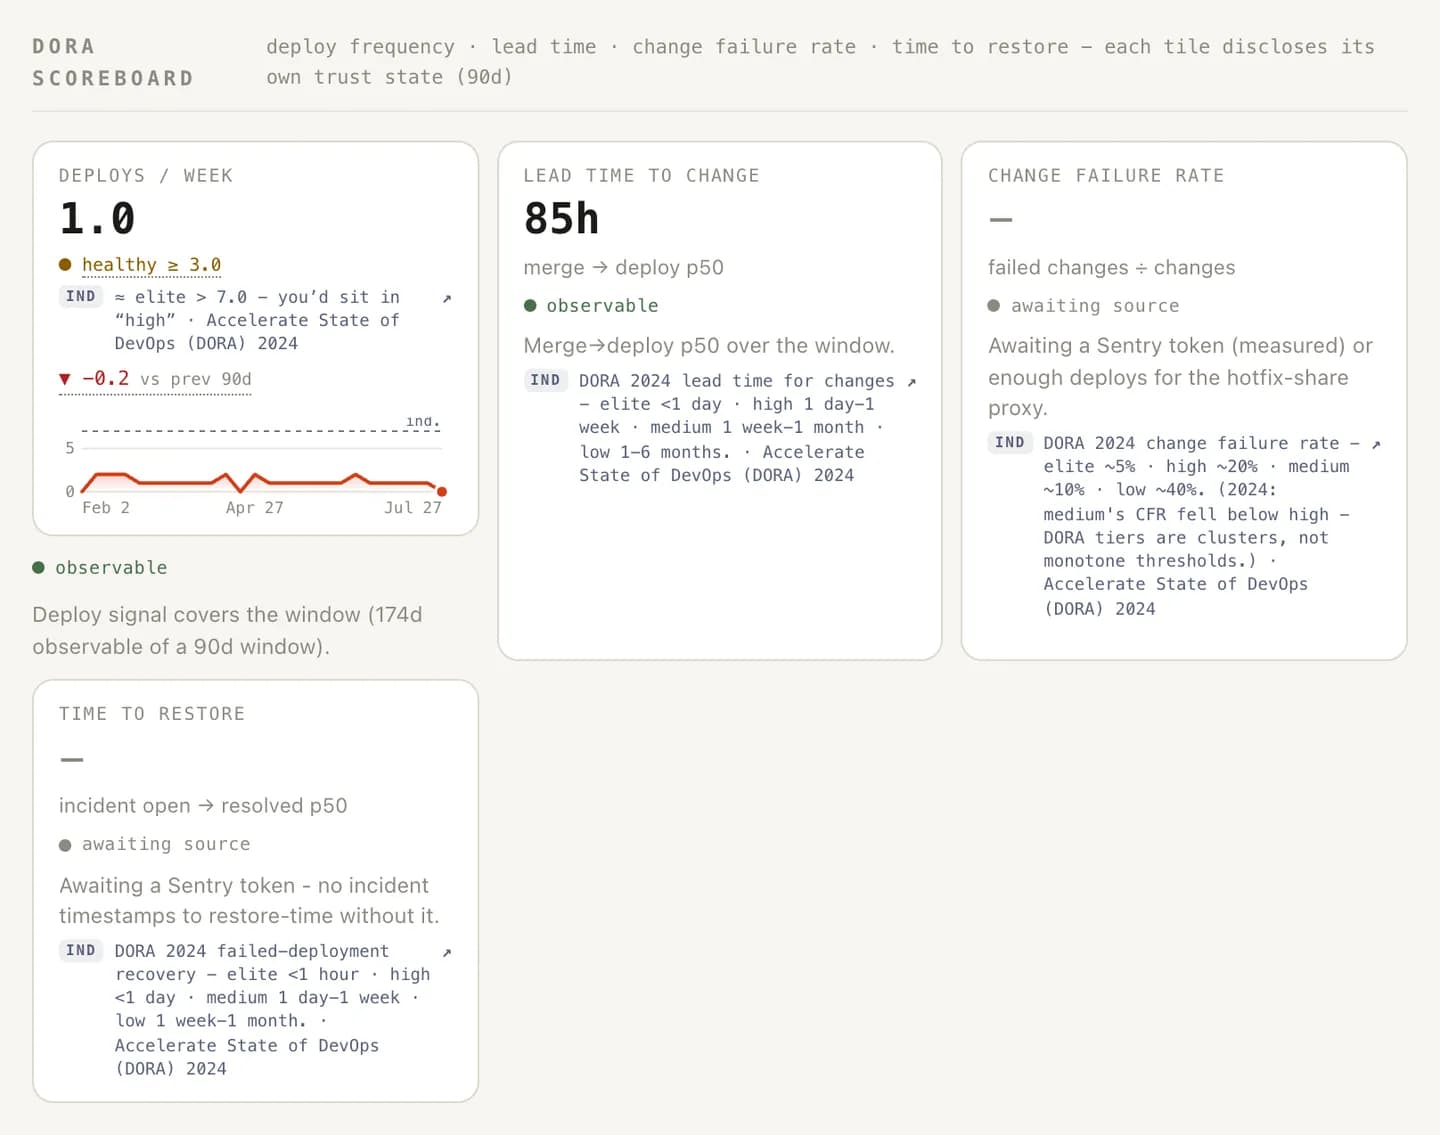
The monthly report above has a manual cost: assembling shipped-with-links, recomputing trends, re-judging each metric. Call it half a day of lead time per month, every month. That assembly is what Busfactor automates, and the pitch is explicit. It connects to GitHub, your board, and CI, and maintains the report's raw material continuously: judged stats (every metric graded healthy / watch / bad against expert bands for your org's size, so the judgment column arrives pre-written), the periodic report card, cycle-time anatomy naming the stage behind any degrading trend, and a delivery forecast computed from your org's own weekly throughput percentiles with the method disclosed on the card - a range you can defend under a board member's questioning precisely because it isn't a black box.
When someone asks "is that good?", the industry reference bands are rendered with citations - study, year, and an ≈ where definitions differ, labeled published-reference-not-peers - so the external context in your deck is checkable rather than vendor folklore. Anything you export is anonymized by construction: share cards are board-ready PNGs with names blurred, so the deck never leaks an engineer's name into a forum that was never meant to judge engineers.
The limits, honestly: Busfactor supplies sections two and three, delivery health and the forecast's mechanical half. Shipped-in-business-language, risks, asks, and the win are judgment calls only you can write; the tool hands you receipts. That is the right division of labor. The machine does the archaeology, and you spend your half-day on the part the CEO is actually paying you for: the judgment.
Frequently asked
What should an engineering status report include?
Five sections, one page: what shipped (linked to the real work, stated in business terms), delivery health (three or four trended metrics with a judgment, not a chart dump), forecast (a range with a track record, not a confident date), risks and asks (the things you need decided or unblocked), and one win worth celebrating. If it takes more than five minutes to read, it will be skimmed instead.
Which engineering metrics do executives care about?
Fewer than engineers assume. Trends in lead time (idea to production), deployment frequency, and change failure rate cover speed and stability; add a delivery forecast and, where relevant, cost framing. What matters is judgment and consistency: the same three or four metrics every month, each with 'improving, flat, or degrading, and here's what we're doing about it.' Raw dashboards delegate the judging to the reader, which is the report's actual job.
How often should engineering report to executives?
A monthly written report with trends and judgment, plus a lightweight weekly or per-cycle pulse (shipped, on-track-or-not, blockers). Consistency beats frequency: the same format on the same day builds more trust than any single impressive update, because trends only mean something when the definitions and cadence hold still.
Should you show velocity or story points to executives?
No. Points are a team-internal planning unit: they aren't comparable across teams, they inflate under attention, and they invite 'why is Team B's number smaller?', a question with no honest answer. Report outcomes (what shipped), time (how long things take), and stability (what broke), quantities an executive can act on without learning your estimation culture.