MTTR Is Four Different Metrics. Pick One Honestly
MTTR IS FOUR METRICS
Repair, recovery, respond, resolve: MTTR hides four different metrics. How to pick one definition, measure it honestly, and read incident data without lying.
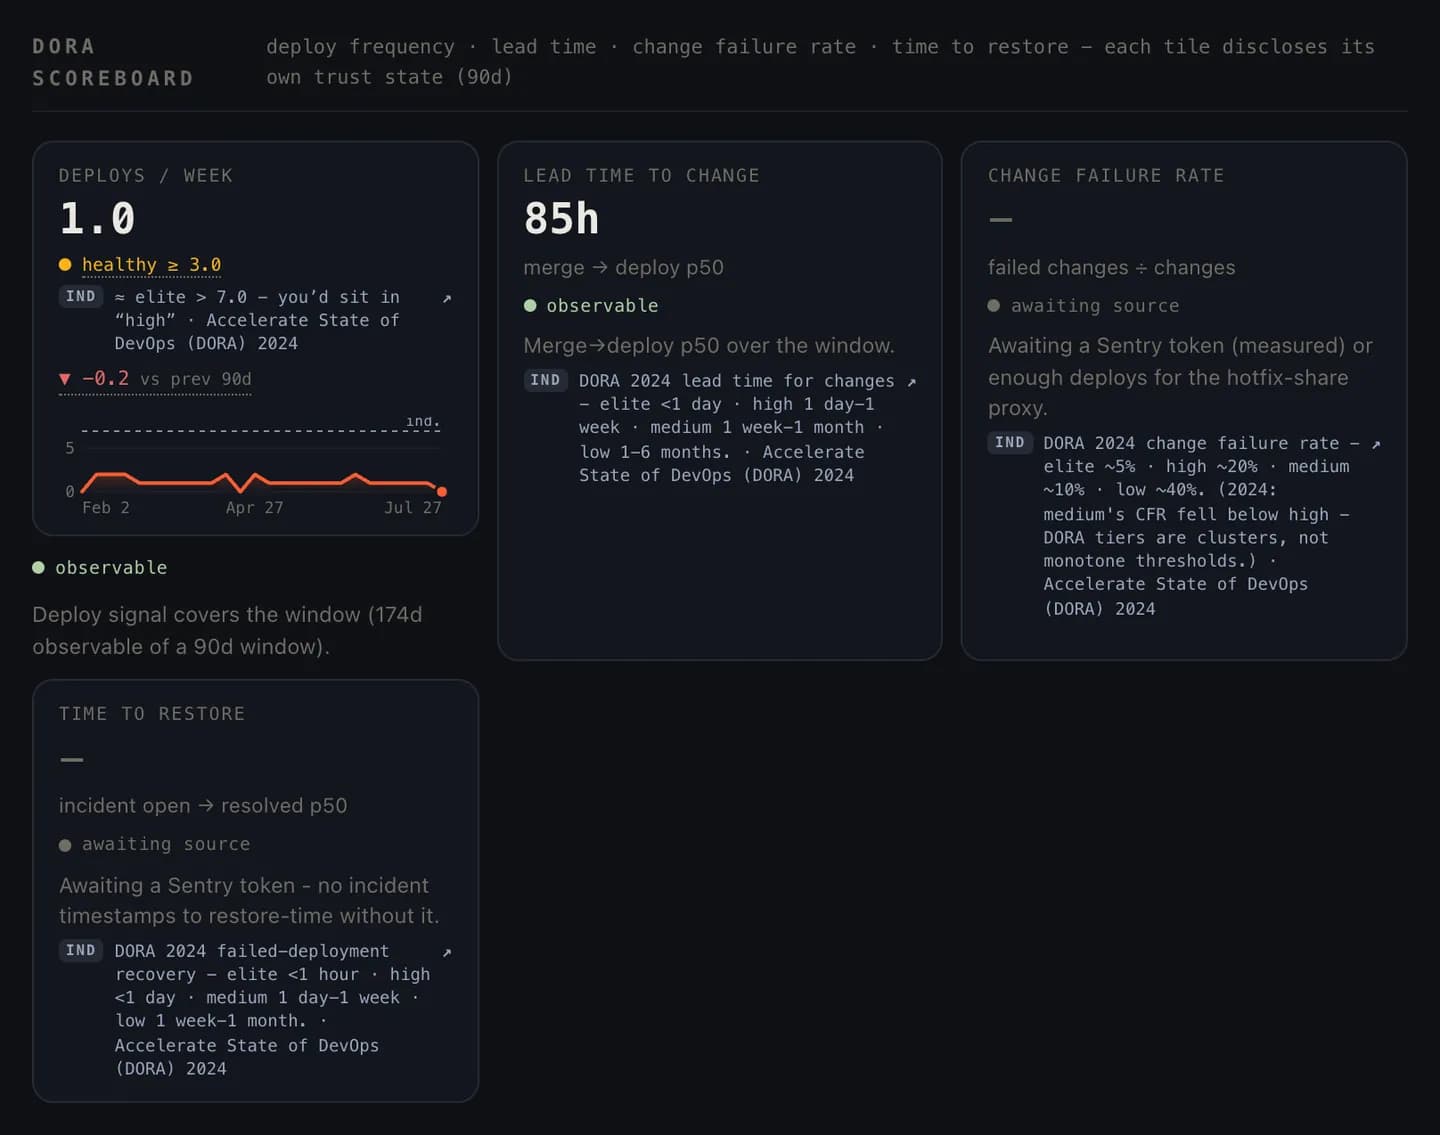
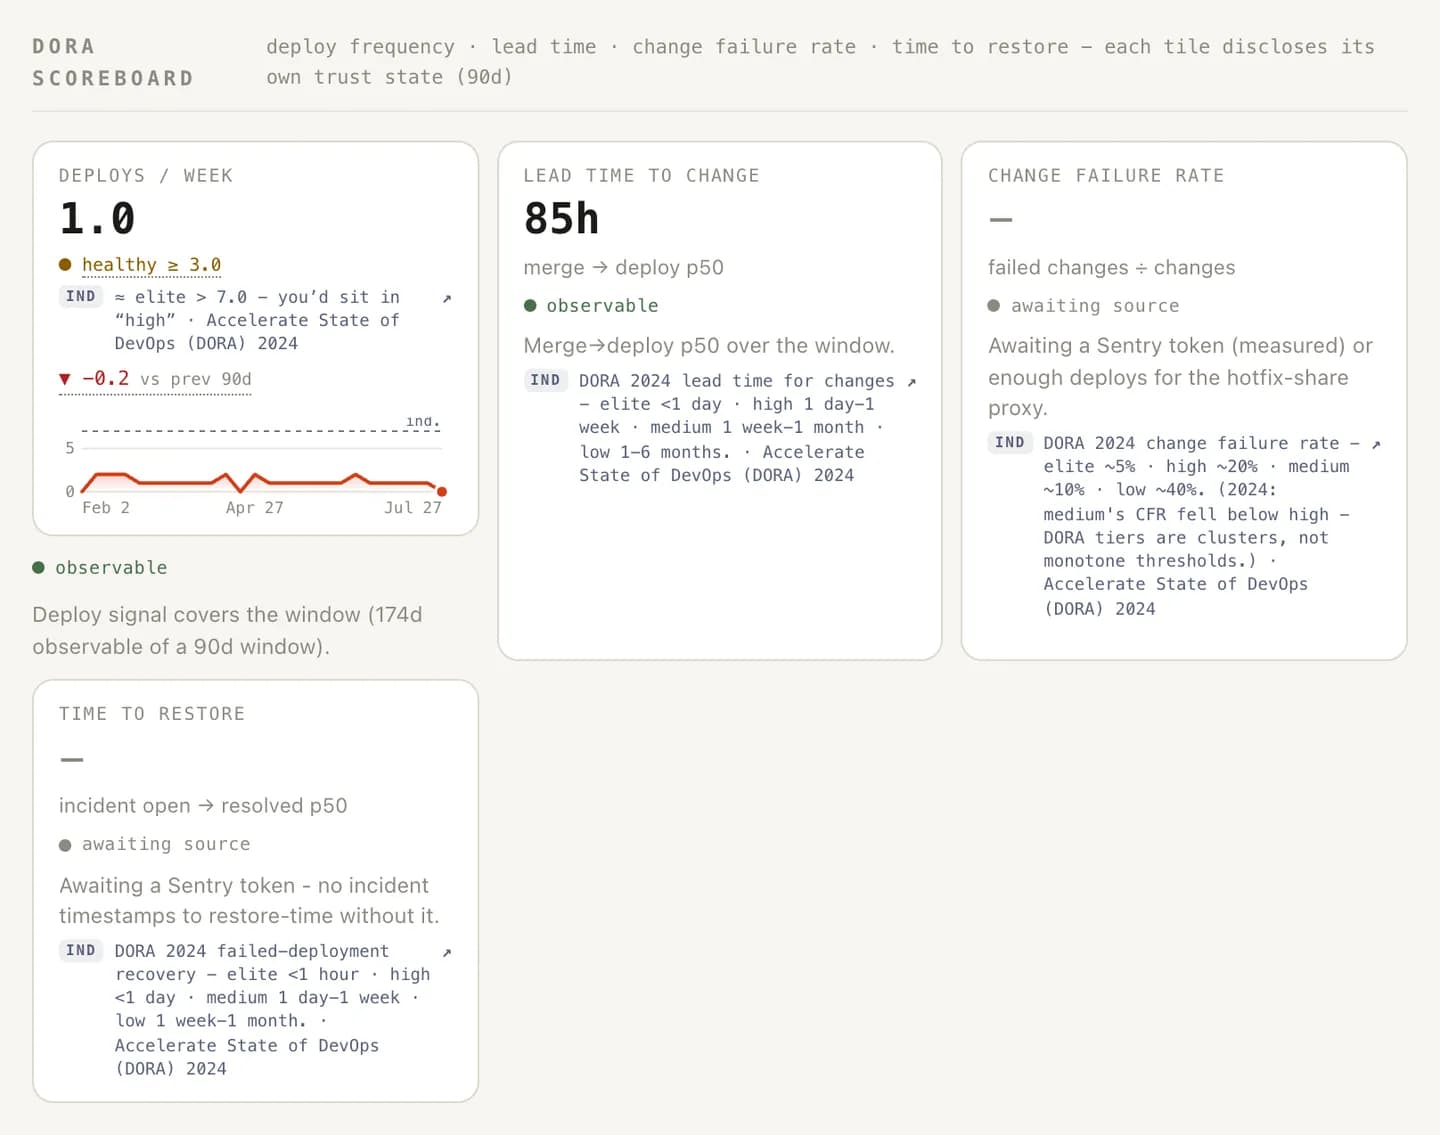
Flat and well above the elite reference - a signal, not a verdict.
Illustrative example
TL;DR: MTTR expands four ways: repair, recovery, respond, resolve. Each one starts and stops a different clock, so teams quote "MTTR" at each other while measuring different things, then wonder why the comparison feels off. Worse, the M is doing crime. Incident durations are heavy-tailed, which means the mean is dragged around by your worst week and describes nothing typical. The honest setup takes an afternoon. Pick one expansion, write down when the clock starts and stops, report the median plus the tail as separate facts, and read it next to change failure rate, because recovery speed is only ever half of a stability story.
"Our MTTR is four hours." Four hours from what to what? From the alert firing or from the customer tweeting? To the page being acknowledged, the service limping back, or the root cause actually fixed? Depending on the answers, that same incident history could honestly report four different numbers. In most orgs, whoever built the dashboard picked one without writing it down.
What does MTTR mean? The four expansions
The acronym is a coat check where four metrics left the same coat:
- Mean time to respond: from detection to a human acknowledging and starting work. This measures your alerting and on-call pipeline, nothing else. It can be world-class while your outages run long.
- Mean time to repair: from start of work to the fix being applied. The manufacturing-era original. Wrench time on the broken thing.
- Mean time to recovery (or restore): from failure to users no longer being affected. Rollback counts. Feature-flag off counts. The forward-fix can come Tuesday. This is the customer-experience clock, and it's the one delivery frameworks care about.
- Mean time to resolve: from failure to the underlying cause being fixed and follow-ups done. Always the longest clock, and the one that quietly punishes teams for doing thorough postmortem work if you treat it as a speed target.
None of these definitions is broken on its own. The trouble starts when you compare your respond to someone else's resolve and draw conclusions. Apples to outages. Each expansion also audits a different part of the system: respond checks your alerting, repair your diagnosis and tooling, recovery your mitigation paths (rollbacks, flags, redundancy), resolve your follow-through.
The DORA version: failed deployment recovery
If you want the definition with the strongest published reference points, take the one from DORA's four keys: the stability metric the 2024 State of DevOps report calls failed deployment recovery time: how long to recover when a deployment causes a failure. The 2024 bands: elite teams recover in under an hour, high performers within a day, medium within a week, low performers take up to a month. (That was the final year of tier tables. The 2025 report retired the elite/high/medium/low model for team archetypes, so 2024 is the last such table there is.)
Two honest caveats before you benchmark against it. First, scope. DORA's metric covers recovery from change-induced failures, the deploy that broke things, not every incident class (a datacenter fire is not a deployment). Second, method. DORA's numbers are practitioner survey responses, coarse bands rather than telemetry. Use them for orientation, and read the metric in its native pair with change failure rate: CFR tells you how often changes fail, recovery time tells you how much each failure costs in exposure. Fast-recovering teams can afford to ship often, which is why the recovery clock, deployment frequency, and CFR only mean things together.
Why the mean is the wrong average
Now for the M, which deserves its own indictment. Incident durations are heavy-tailed: most recoveries are short, a few are horror shows, and there is no bell curve in sight. The mean of a heavy-tailed distribution is a rumor started by your worst incident.
Run the arithmetic on a plausible quarter: twelve incidents recovered in about twenty minutes each, plus one genuine mess that took two days. The mean lands north of three and a half hours, a duration that describes not one incident you actually had. The median, twenty minutes, tells the true story of a typical incident. The two-day outage deserves to be discussed as what it is: a specific story with a specific cause.
A mean that improves might mean you got better, or just that you had a lucky quarter with no tail event. You can't tell from the number, which makes it a poor number to steer by.
The honest reporting format is three separate facts: median (the typical case), a high percentile or the worst incident (the tail, named and narrated), and the count. Never let one number carry all three jobs.
How to measure recovery time honestly
- Pick one expansion and write it down. One sentence, in the runbook: "We measure time to recovery: clock starts at detection, stops when user impact ends." The writing-down is the actual work; every future argument about the metric is settled by this sentence.
- Define both clock edges. Start: detection (when you knew), not occurrence (when it began) - but then track detection lag separately, or slow alerting will flatter your recovery number while your users eat the difference. Stop: user impact ended, even via rollback. Mitigation counts; thoroughness gets its own clock.
- Report median plus tail, per severity. A SEV-3 and a SEV-1 in the same average produce a number about nothing. Segment, then trend each band over time. Trends survive definitional quirks that absolute comparisons don't.
- Read it with its stability partner. Recovery time without change failure rate is half a sentence. Fast recovery + high CFR = good firefighters, flammable building.
- Never make the clock a target for humans mid-incident. A responder watching a stopwatch closes incidents prematurely - the metric gets better as reality gets worse. Recovery time is a system diagnostic for after the smoke clears, feeding the same improvement loop as the rest of your delivery scoreboard, ideally via a retro with receipts.
The door here is cheap and immediate. Fixing MTTR needs no new tooling, just one paragraph of definition and a median. An afternoon of honesty about what your clock measures buys you the thing the acronym always promised - a recovery number you can trust when it moves.
Frequently asked
What does MTTR stand for?
Four different things, which is the problem: mean time to repair, mean time to recovery, mean time to respond, and mean time to resolve. Each starts and stops a different clock: respond ends at acknowledgment, recovery ends when users are unaffected, resolve ends when the underlying cause is fixed. Two teams comparing 'MTTR' are usually comparing different metrics.
What is a good MTTR?
The best-known published reference is DORA's 2024 failed-deployment recovery bands: elite teams recover in under an hour, high performers within a day, medium within a week, and low performers take up to a month. Use them as orientation rather than a scoreboard; the bands only make sense for the recovery definition, measured the way DORA measures it.
Why is the mean a bad average for recovery time?
Because incident durations are heavy-tailed. Most recoveries are short; a few are catastrophically long, and those few drag the mean far away from the typical case. One multi-day outage in a quarter of twenty-minute recoveries makes the mean describe nothing you actually experienced. Report the median for the typical case and discuss the worst incidents separately, as stories.
Is MTTR still a DORA metric?
The concept survives under a clearer name. DORA's four keys include the stability metric now called failed deployment recovery time - how long it takes to recover from a deployment that caused a failure. The 2024 report was the final year of the elite/high/medium/low tier tables; the 2025 report retired that model in favor of team archetypes.