DORA Metrics Explained (Without the Fluff)
The four DORA keys, the real 2024 elite/high/medium/low bands, and the caveats the consultant deck skips - including why 'medium' beat 'high' on failures.
Source: DORA 20244 receipts in this article ↓
TL;DR: DORA's four keys - deployment frequency, lead time for changes, change failure rate, failed-deployment recovery time - are the best-evidenced scoreboard in software delivery. The 2024 bands: elite deploys on demand with ~5% failure rate and sub-hour recovery; low ships every one to six months and takes up to a month to recover. The fine print matters: the tiers are descriptive survey clusters (in 2024, "medium" beat "high" on failure rate), and DORA itself retired the tier model in 2025. Use the keys to find your constraint, and never pay anyone on them.
If you've sat through a DevOps vendor pitch in the last five years, you've seen the DORA slide. Usually it's missing the sample caveats, the 2024 anomaly, and the fact that DORA no longer publishes the tiers at all. Here's the version with the receipts left in.
What are DORA metrics?
DORA (DevOps Research and Assessment) is the research program behind the annual Accelerate State of DevOps reports, built on a decade of surveys across tens of thousands of professionals. Its core finding, laid out in the Accelerate book: software delivery performance can be measured with four metrics, those metrics cluster into performance profiles, and high performers were twice as likely to exceed their profitability, market-share, and productivity goals.
The four keys:
- Deployment frequency: how often your organization deploys code to production.
- Lead time for changes: how long a commit takes to reach production.
- Change failure rate: what share of deployments cause a failure needing remediation (hotfix, rollback, patch).
- Failed-deployment recovery time: how long restoring service takes when a deployment fails (the metric formerly known as MTTR, a rename worth respecting, since "MTTR" hides at least four different measurements).
The architecture is deliberate: two speed metrics, two stability metrics. Either pair alone is easy to optimize dishonestly - infinite stability is available to teams that never ship, and impressive speed is available to teams that ship garbage.
The research's most durable claim is that the trade-off is a false one. The same practices that make you fast (small batches, automated tests, fast feedback) also make you stable, which is why teams with faster code review showed 50% higher software delivery performance in the 2023 report.
The performance bands, and the anomaly in the middle
The 2024 report was the final year DORA published the famous elite/high/medium/low tiers. Here is that last table:
| Metric | Elite | High | Medium | Low |
|---|---|---|---|---|
| Deployment frequency | On demand (multiple per day) | Daily-weekly | Weekly-monthly | Monthly-every 6 months |
| Lead time for changes | Under 1 day | 1 day-1 week | 1 week-1 month | 1-6 months |
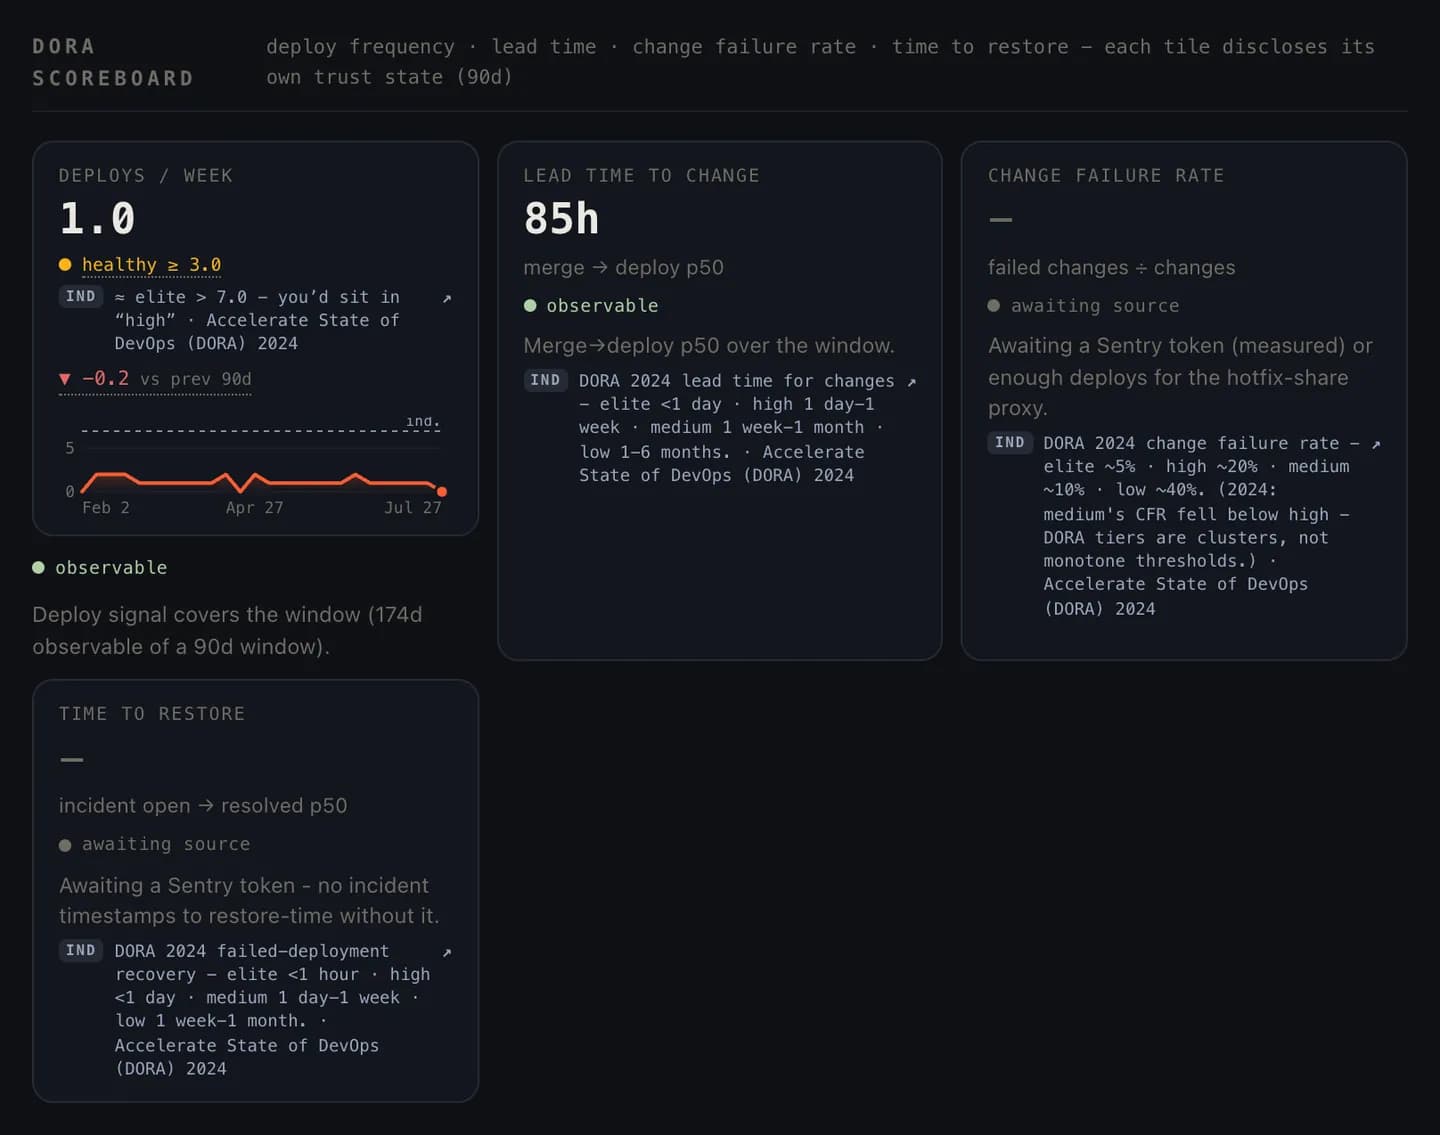
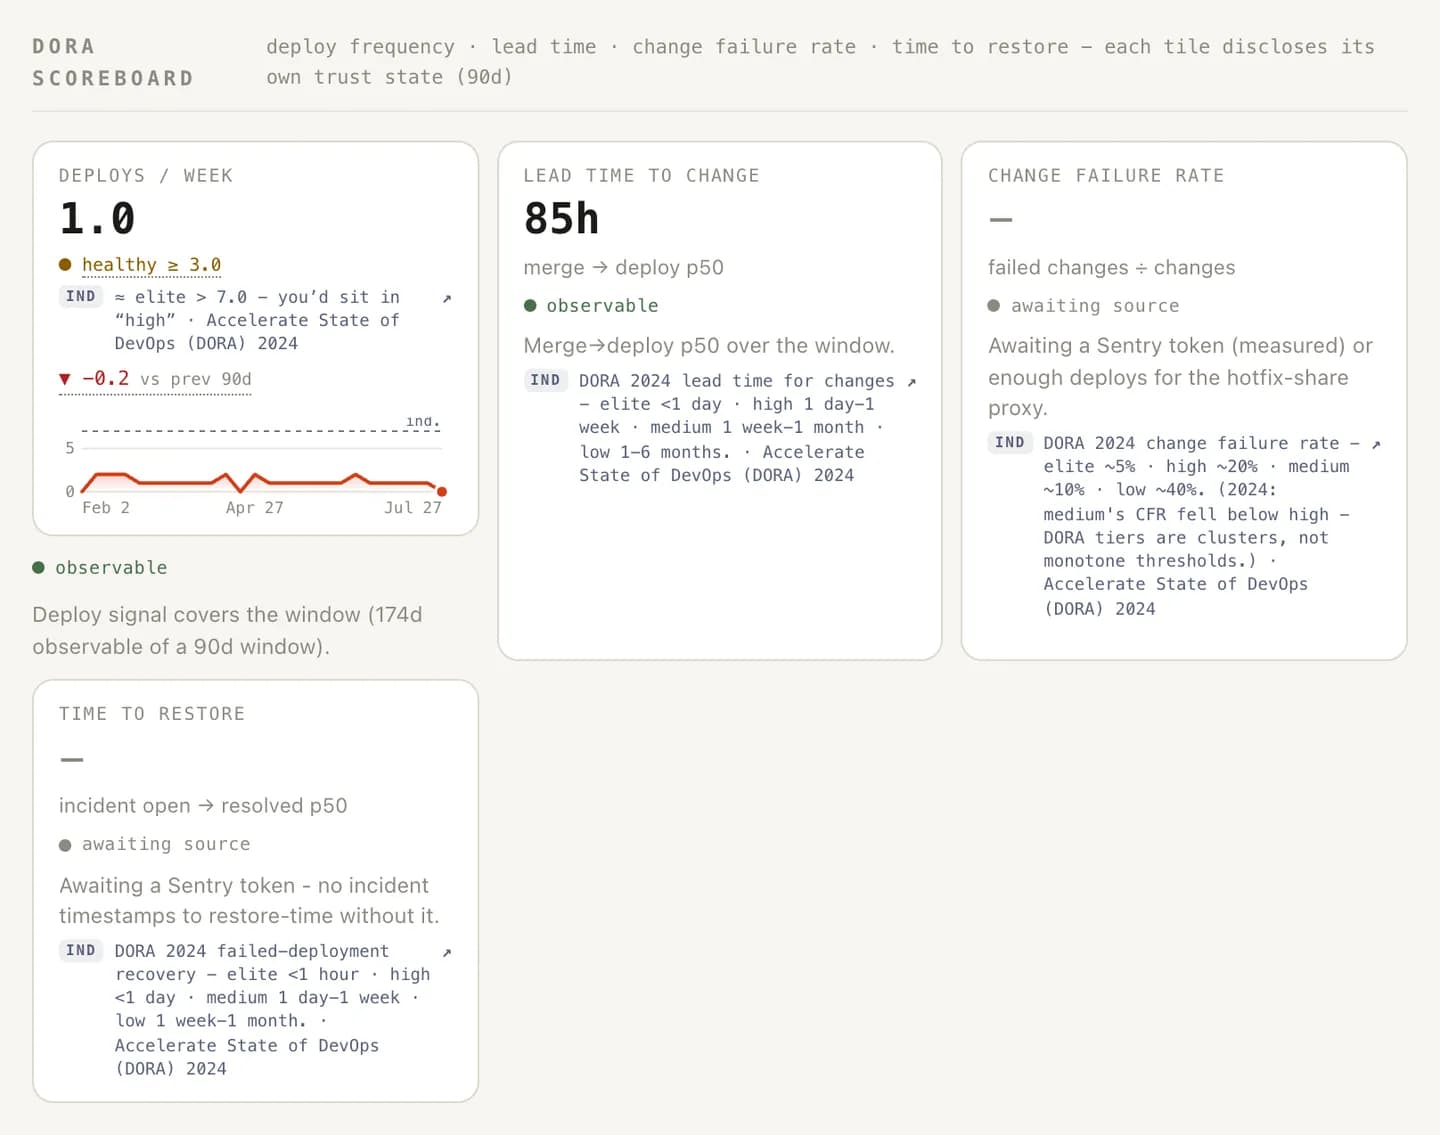
| Change failure rate | ~5% | ~20% | ~10% | ~40% |
| Failed-deployment recovery | Under 1 hour | Under 1 day | 1 day-1 week | 1 week-1 month |
Cluster sizes in 2024: elite 19%, high 22%, medium 35%, low 25%. Elite is no mythical 1%; roughly one team in five surveyed operates there. But the median team lives in "medium": deploying somewhere between weekly and monthly, with a week-to-month lead time.
Read that change-failure-rate row again, because it's not a typo. In 2024, the medium cluster reported a lower change failure rate (~10%) than the high cluster (~20%). That's your proof that the tiers are k-means clusters over survey responses, bundles of teams that resemble each other. A cluster can be faster and messier than the one "below" it. Anyone selling you the table as a ladder with clean rungs hasn't read the report.
The caveats the consultant deck skips
It's survey data. DORA's numbers are self-reported by practitioners, not telemetry pulled from pipelines. Self-reports of "how often do you deploy?" are honest-ish but lossy: people report the story of their team rather than its logs. Directionally robust across a decade; not precise to the decimal.
The tiers are dead; DORA killed them. The 2025 report retired the elite/high/medium/low model entirely, replacing it with seven team archetypes, an acknowledgment that four labels flattened too much reality. The 2024 table above is the last of its line. It remains a genuinely useful orientation; it is no longer a live standard.
Elite is a context. On-demand deployment is the right bar for a SaaS web product. For firmware, mobile releases gated by app-store review, or a regulated payments core, the practices (small batches, fast feedback) still apply while the literal cadence may not. Chasing the label without the context is how you get change-advisory-board theater in reverse.
The four keys report symptoms. A bad lead time doesn't tell you where the time goes. For that you need to decompose the pipeline into stages (cycle time vs lead time covers how, and PR pickup time covers the stage that's usually guilty). Change failure rate, likewise, is a cousin of your rework rate; both are the bill for oversized, under-reviewed batches.
New forces move the keys. The 2024 report also measured AI's effect on delivery and found that a 25-point increase in AI adoption was associated with a 1.5% decrease in delivery throughput and a 7.2% decrease in delivery stability. That is the industry's new favorite tool measurably pushing the four keys the wrong way absent strong controls. Whatever your tier, that's a variable your 2020 playbook didn't have.
Using DORA metrics without fooling yourself
- Measure from systems. Pull deployment frequency and lead time from your actual pipeline and git history, never from self-assessment. The gap between "we deploy daily" (the standup answer) and the deploy log is routinely a full tier.
- Locate yourself honestly on all four. No cherry-picking the flattering pair. Speed without stability is recklessness; stability without speed is rigor mortis.
- Trace the worst key to its stage. Bad lead time? Decompose it; the constraint is usually a waiting queue rather than slow work. The whole method lives in the delivery-metrics hub.
- Fix the constraint; re-measure; repeat. Deployment frequency usually moves through batch size. Nobody types their way up a tier.
- Never pay on the keys. The moment a four-key number is a bonus target, you'll get the number without the improvement. Goodhart's law has a perfect record.
The four keys earned their reputation: they're simple, hard to argue with as a pair of pairs, and backed by the largest research program our industry has. Just use the 2024 table the way DORA meant it - a mirror, held up honestly - and not the way the slide deck means it, as a ladder to be climbed by any means the dashboard will accept.
Frequently asked
What are the four DORA metrics?
Deployment frequency (how often you ship), lead time for changes (commit to production), change failure rate (share of deployments causing a failure), and failed-deployment recovery time (how fast you restore service). Two speed metrics, two stability metrics, designed to be read together.
What counts as elite in DORA metrics?
In the 2024 report (the final year DORA published tiers) elite meant deploying on demand (multiple times a day), lead time under a day, a change failure rate around 5%, and recovery from a failed deployment in under an hour. About 19% of surveyed teams landed in that cluster.
Are DORA tiers still used?
DORA itself retired the elite/high/medium/low model in 2025, replacing it with seven team archetypes. The 2024 bands remain the last published tier table and are still a useful orientation, as long as you treat them as descriptive clusters of survey data, not certified thresholds.
Can you game DORA metrics?
Trivially, which is the strongest argument against making them targets. No-op deploys inflate frequency; refusing to ship 'risky' work suppresses change failure rate; reclassifying incidents shortens recovery on paper. Use the four keys to find constraints, and validate any improvement against the underlying behavior.