Your Team Isn't Slow - It's Stuck in Queues You Can't See
NOT SLOW. STUCK.
When engineering feels slow, the reflex is pressure and process. The real first step is cheaper: find where the time goes - most of it is waiting, not working.
TL;DR: Your gut is right - delivery is slow. Your explanation is wrong. It isn't the people; it's the queues between them, and elite teams differ from slow ones by 6x+ on cycle time for exactly that reason. The first move is free: trace your last ten shipped changes and split the elapsed time into working and waiting. One queue almost always owns the damage. Fix that one. Pressure, process, and velocity charts just treat the symptom.
You've had the conversation. Maybe with your co-founder, maybe with the board, maybe just with yourself at 11pm: why does everything take so long here? The team is good. Everyone is visibly, exhaustingly busy. And features still land weeks after you privately expected them - again.
Nobody tells you this part: the slowness is real, it's probably not your engineers, and it's hiding somewhere you've never looked. You're watching people work, but delivery time isn't spent in the work. It's spent in the gaps between the work, and nobody watches the gaps.
The slowness is in the waiting, not the working
A change's elapsed time - first commit to production - is work time plus wait time, and wait time is what actually separates fast teams from slow ones. LinearB's benchmarks across 8.1 million+ pull requests put elite teams under 25 hours of cycle time (p75) and flag over 161 hours as "needs focus." That's a 6x+ spread, and typing speed explains none of it. Queues do. DORA's 2024 report shows the same spread in lead time for changes: elite teams under a day, low performers between one and six months.
Two more numbers to calibrate how much stillness there is inside the working half. Parnin & Rugaber studied 10,000+ programming sessions and found only about 10% of interrupted sessions resume editing within a minute; about 30% take over half an hour to get back to code. And in the 2024 Stack Overflow survey, 61% of developers reported spending more than 30 minutes every day just searching for answers or solutions. Your team can be genuinely excellent and still lose a shocking share of the week to reacquiring context and waiting for someone else's attention.
The trap: busy-ness causes the problem. When everyone is fully loaded, nobody has slack to pick up a review, unblock a decision, or push the thing that's 95% done over the line. Utilization goes up; flow goes down. Your team can be simultaneously overworked and slow. Most slow teams are, and that is the reason "work harder" backfires.
The three reflexes that make it worse
- Apply pressure. If elapsed time is 80% waiting, working faster attacks the 20%. You burn goodwill to buy hours while the days sit untouched.
- Add process. More estimation ceremony, more status meetings, more Jira states. Each one adds a queue to a system that's slow because of queues.
- Stare at a velocity chart. Story points are a team-local currency that inflates under scrutiny, and the SPACE research is blunt that productivity can't be read off a single metric. A rising velocity chart can coexist with nothing improving. Yours probably does.
- Go looking for "the slow ones." The most expensive reflex of all. Stack-ranking engineers reliably backfires, and it's the wrong instrument besides: if your delay lives in the handoffs, individual performance stats will point you at people while the bottleneck sits between them.
The cure starts free: trace ten shipped changes
This costs one afternoon, needs zero new tools, and works even if you never spend a cent on anyone's product, including ours.
- Pick the last ten changes that reached production. Not the flattering ones - the last ten.
- Collect the timestamps you already have: first commit, PR opened, first review activity, approval, merge, deploy. GitHub and your CI have all of them.
- Split each change's elapsed time into stages (coding, waiting for pickup, in review, waiting to merge, waiting to deploy) and mark each stage working or waiting. Ten minutes on cycle time vs lead time if the boundary feels fuzzy.
- Add up the waits, and find the winner. One queue almost always dominates.
For calibration on what "good" looks like: Google's study of ~9 million reviewed changes found a median under 4 hours for the entire review process, with first feedback in under an hour for small changes. If your median wait for a reviewer to start is measured in days, you just found the answer, and the answer is an unmanaged queue: a fixable, blameless, mechanical problem. Pickup time is usually the cheapest queue to fix first.
Fix exactly one queue. Re-run the trace in a month.
Three more free checks, if the trace didn't settle it
- Count work-in-progress per person. If everyone is carrying four or five things, everything is moving and nothing is finishing. WIP limits are the boring cure that works.
- Look at PR size. The SmartBear/Cisco review study found reviews catch 70-90% of defects when changes stay in the 200-400 line range a reviewer can actually hold in their head. Small PRs also clear every queue faster than big ones.
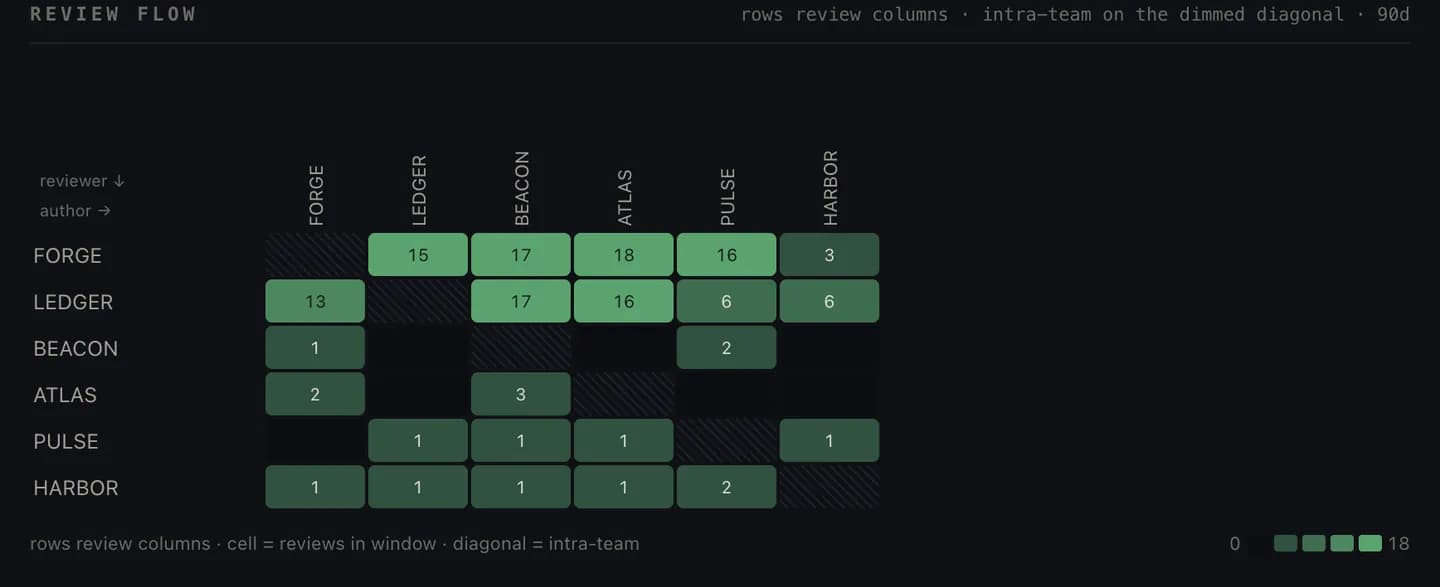
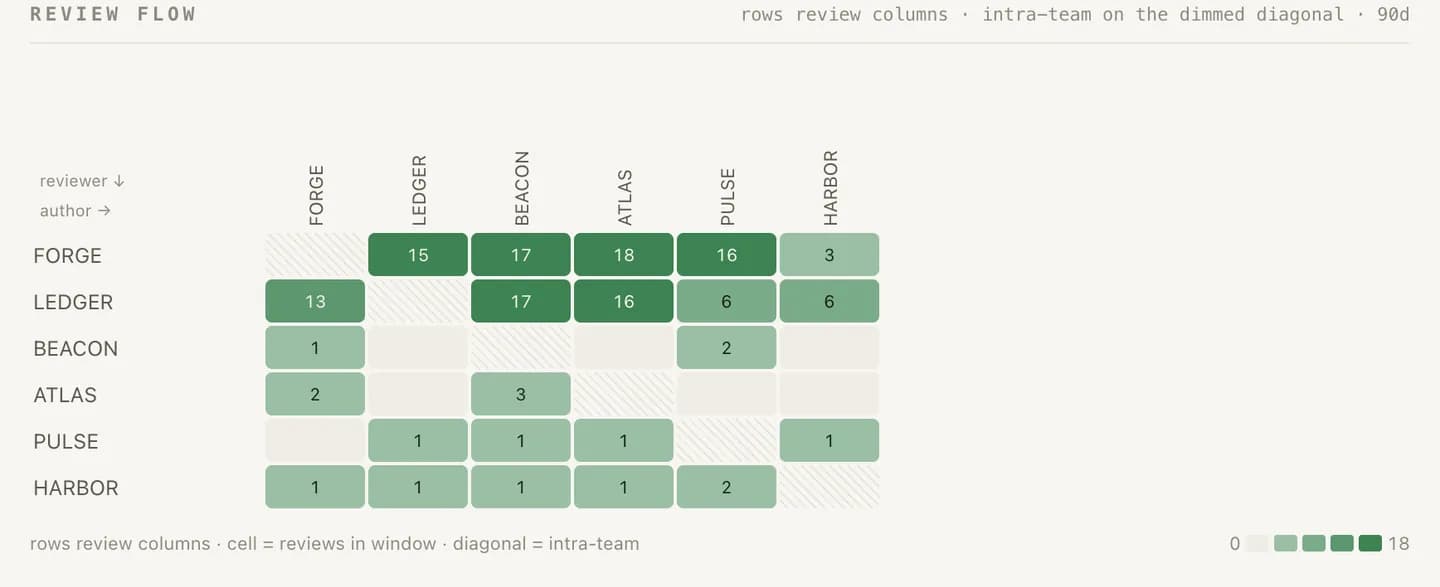
- Ask where work waits on one specific person. If a queue always forms in front of the same name, the speed problem is a symptom. You're one engineer away from a much bigger one.
Why you'll be back here in three months
The ten-change trace is a biopsy; the disease is chronic. Queues regrow the moment attention moves elsewhere. A reviewer goes on leave, a deploy window tightens, WIP creeps up, and you won't feel any of it until the roadmap slips again. That is the honest case for instrumenting this instead of spot-checking it: stage-level cycle time computed continuously from your real GitHub and deploy events, so "we feel slow" becomes "pickup wait doubled in March when two reviewers went on leave," with the PRs to prove it.
That's what Busfactor does. It connects to what you already run (GitHub, your tracker, CI) and shows you where the hours actually sit, every number linked to the commit and pull request it came from, plus what the waiting costs you in your own currency. What it honestly can't do: tell you whether you're building the right things, or compress your roadmap by magic. Any tool claiming to measure "developer productivity" as one number is selling you the velocity chart again. "Where does the time go" is the question a tool genuinely answers, and it is the question behind releases that keep slipping, estimates that never survive contact, and ship dates you can't give your CEO.
One more honest limit, because it changes how you use any of this: event data shows you where work waits, never why. It can't see the meeting that should have been a comment, the requirement nobody could pin down, or the dependency argued out in a DM. Numbers locate the bottleneck; the conversation about why it exists still has to happen with the team. SPACE's advice to include perceptual measures, literally asking people what slows them down, remains some of the best free tooling there is.
The door
Run the trace this week. It's free, and the biggest wait will surprise you. Then, if you want the chronic version handled, get your org's free read. One connection buys the delivery diagnosis a fractional CTO would charge you a retainer for: the queues, the receipts, and the fix. Better than the 11pm feeling that everything is slow and no idea why.
Frequently asked
Why does delivery feel slow even when the team is clearly busy?
Because busy and flowing are different things. Elapsed delivery time is mostly queue time: work sitting between people rather than work being done. A team can be at full utilization while every change spends days waiting for pickup, review, or a deploy slot. The feeling of slowness is usually the waiting, and the waiting is invisible unless you measure it.
What's the first thing to do when velocity feels too slow?
Trace the last ten shipped changes from first commit to production using timestamps you already have: commits, review events, merges, deploys. Split each into working stages and waiting stages, then add up the waits. That afternoon of archaeology tells you which queue is eating your calendar, which is more than most process changes ever establish.
Is hiring more developers the fix for slow velocity?
Rarely as the first move. If elapsed time is dominated by waiting (for review, for decisions, for deploys), more people add more work into the same queues and can make the waits longer. Fix the largest queue first; it's cheaper than a hire and you'll know within weeks whether it worked.
What does a healthy cycle time look like?
LinearB's benchmarks across 8.1M+ pull requests put elite teams under 25 hours from first commit to production (p75) and flag over 161 hours as needing focus. DORA's 2024 tiers tell the same story in lead time: elite under a day, low performers one to six months. The spread is queues, not typing speed.
Should I measure individual developer speed to find the slow ones?
No, and not just for kindness reasons. The SPACE research is explicit that no single metric captures productivity, and if the delay lives in queues and handoffs, per-person speed stats will point you at people while the actual bottleneck sits between them. You will spend a quarter performance-managing someone whose PRs were waiting three days for a reviewer.
Receipts
- LinearB - Engineering Benchmarks (8.1M+ PRs)
- DORA - Accelerate State of DevOps Report 2024
- Sadowski et al. - Modern Code Review: A Case Study at Google (ICSE-SEIP 2018)
- Forsgren, Storey, et al. - The SPACE of Developer Productivity (ACM Queue, 2021)
- SmartBear - Best Practices for Peer Code Review (Cisco study)
- Parnin & Rugaber - Resumption strategies for interrupted programming tasks (SQJ 2011)
- Stack Overflow Developer Survey 2024 - Professional Developers