How to Measure the ROI of AI Coding Tools
SEAT PRICE ISN'T ROI
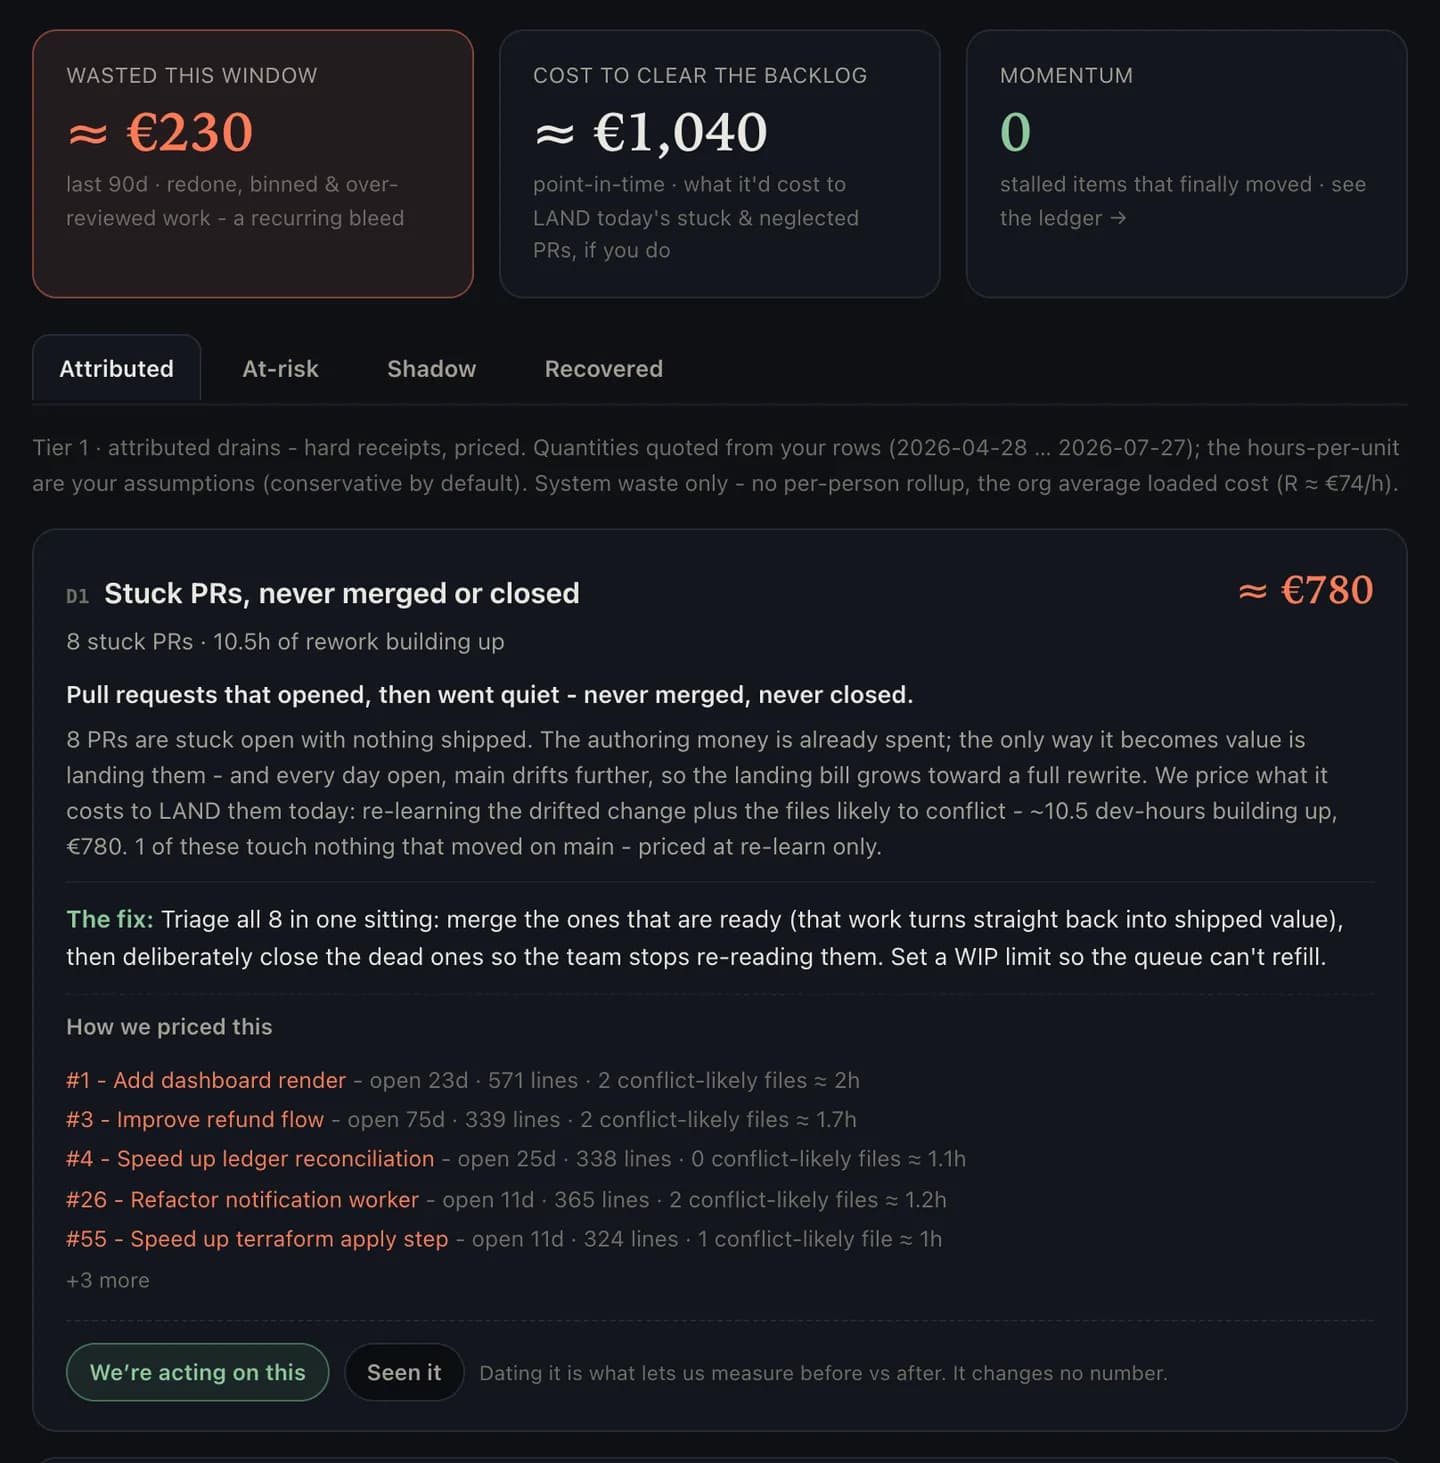
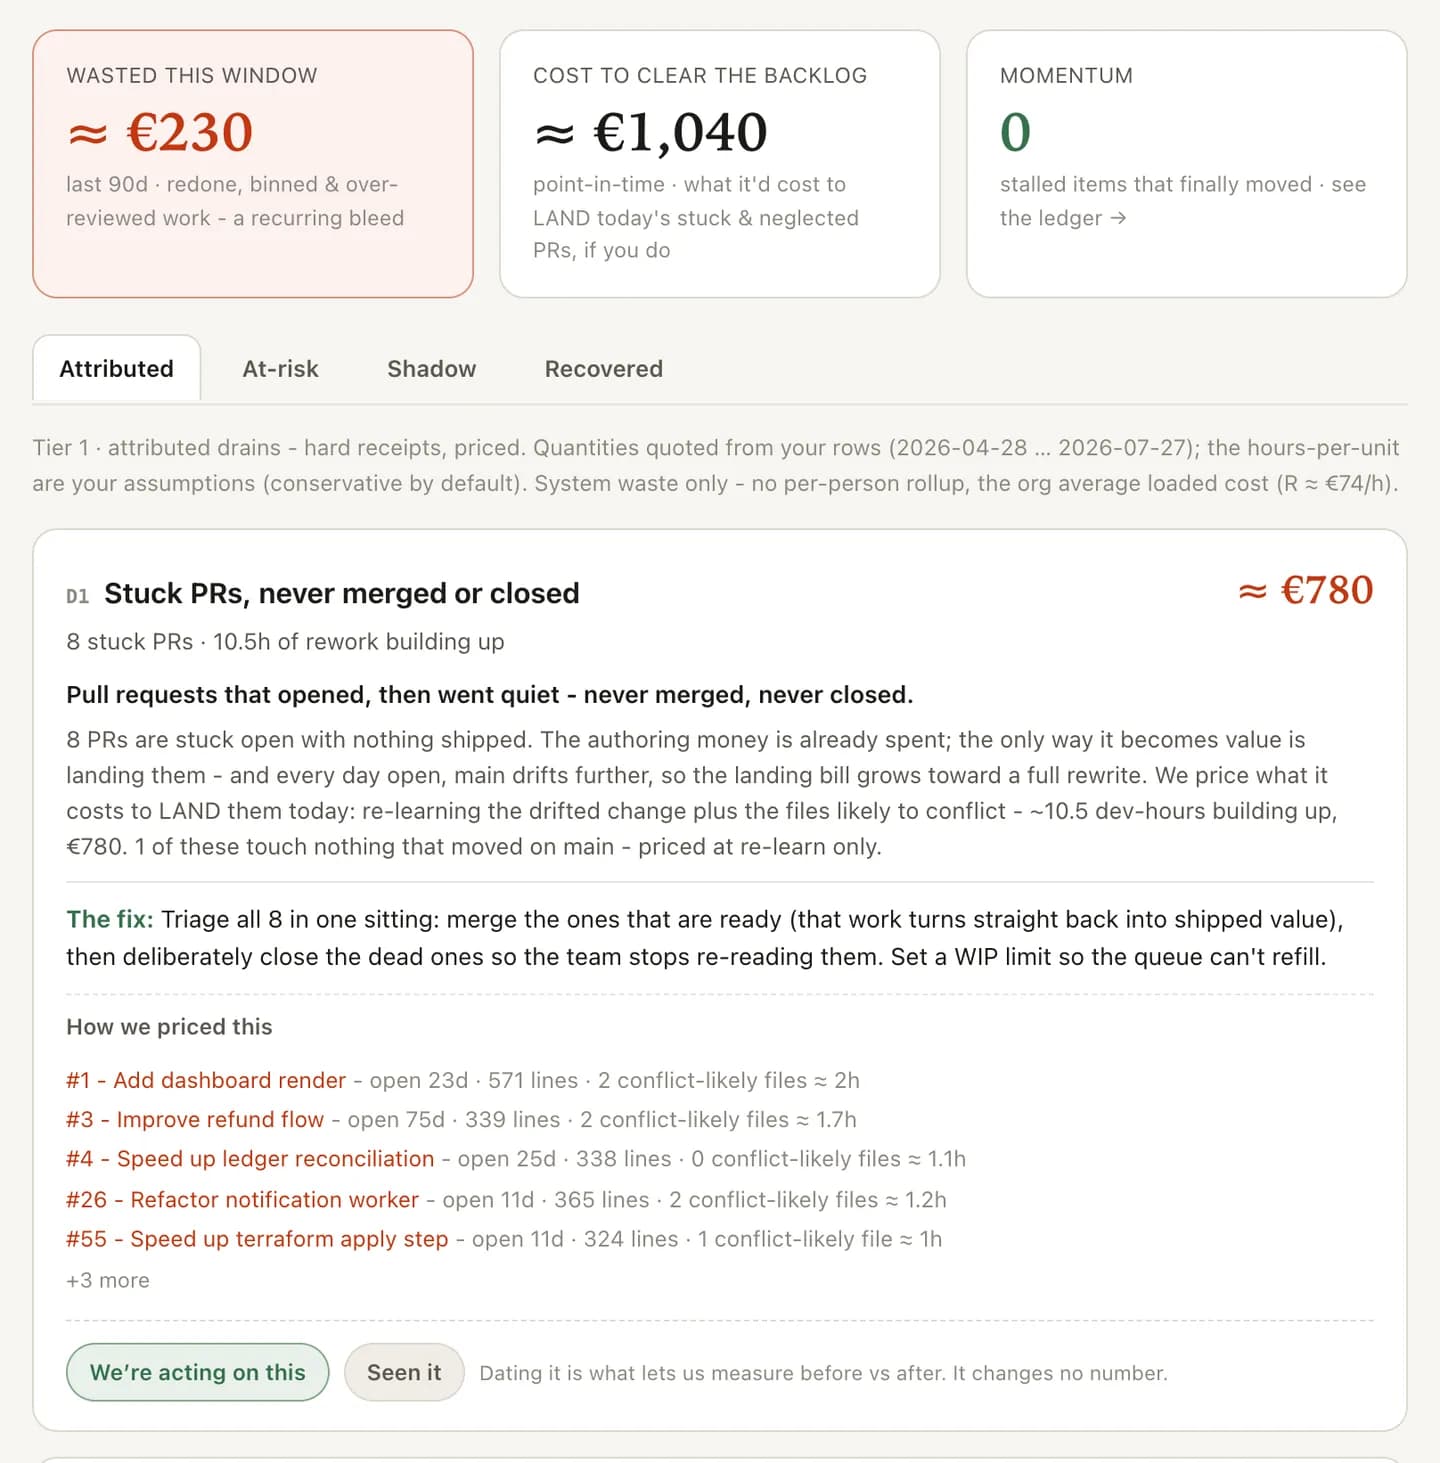
Seat price is easy; return is not. What to measure beyond acceptance rate - churn, rework, review burden - before calling an AI coding tool a win.
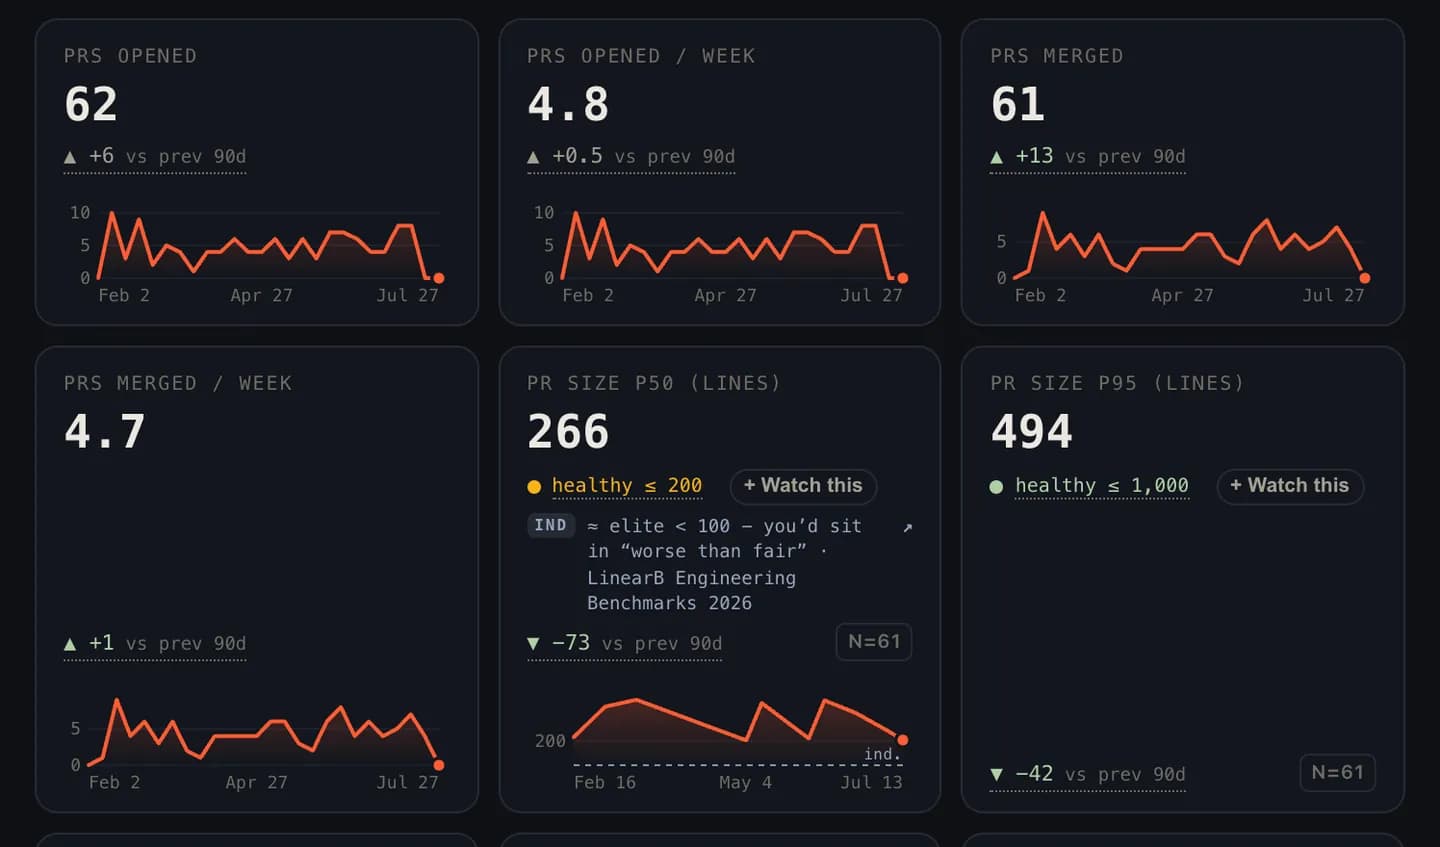
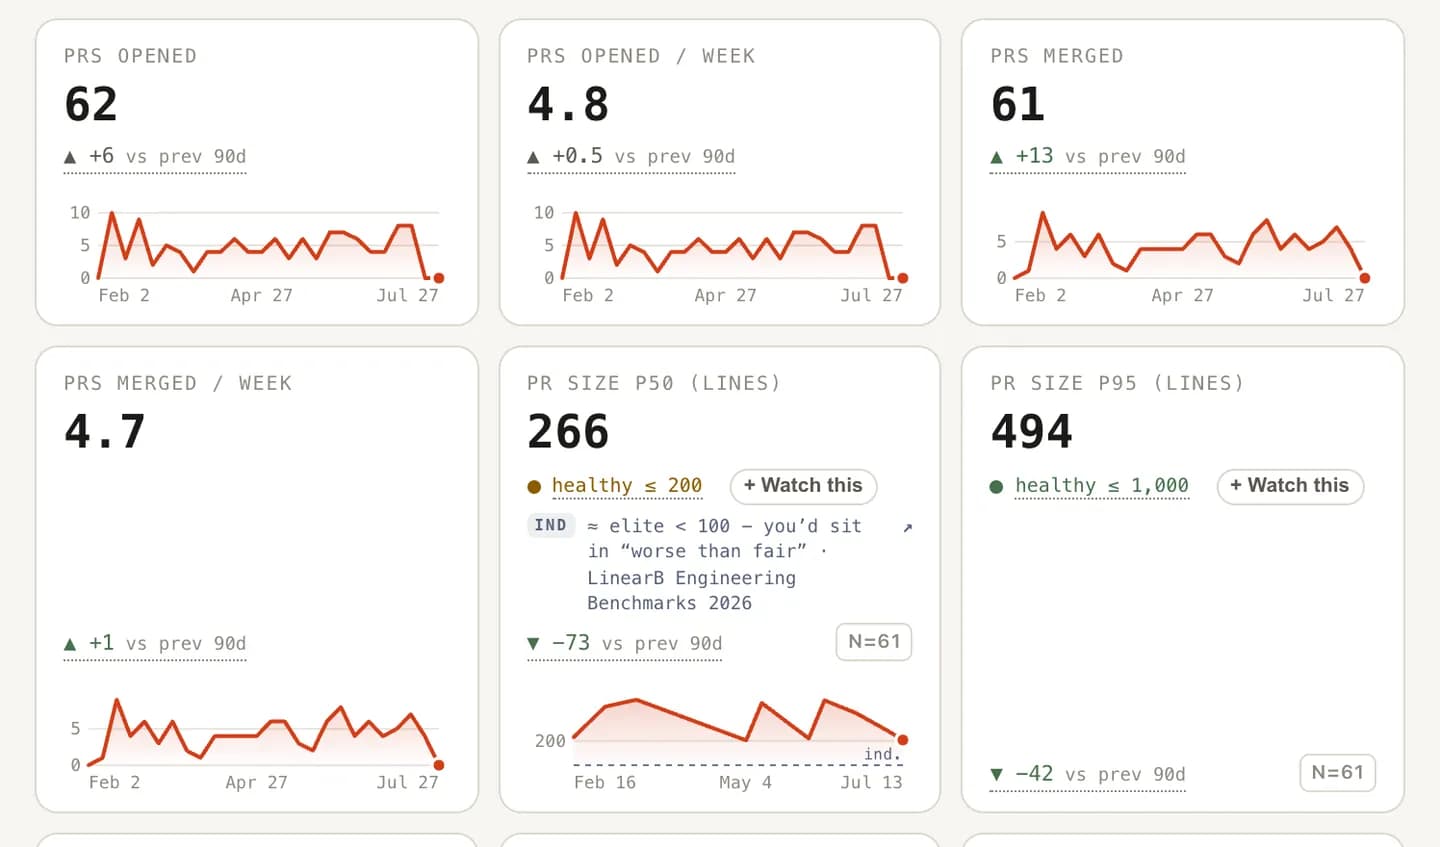
Flat and well above the elite reference - a signal, not a verdict.
Illustrative example
TL;DR: The ROI of an AI coding tool is measured value delivered minus measured total cost, and almost nobody measures either. Acceptance rate is a vendor's number about agreeableness. The honest method: baseline your delivery before rollout, attribute AI work explicitly, count churn and rework against the gains, and judge in engineer-hours over quarters. It's less flattering than the dashboard. It's also true.
Why acceptance rate is not ROI
Every AI coding vendor ships a dashboard, and the headline number is almost always some flavor of acceptance rate: how often developers kept what the tool suggested. It's a fine metric - of suggestion agreeableness. It says nothing about return, for three measurable reasons.
First, accepted is not delivered. An accepted suggestion that gets rewritten in the following sprint was a cost wearing a win's badge. GitClear's analysis of 623 million code changes measured two-week churn (code revised or discarded shortly after shipping) up 15% across the AI era. Acceptance rate counts those lines once, on the credit side. Reality counts them twice, and the second entry is a debit.
Second, headline speedups come from headline conditions. The most-quoted controlled result in the field - developers with Copilot completing a task 55.8% faster - came from 95 developers implementing an HTTP server in JavaScript: bounded, greenfield, well-specified. Your backlog is not 100% HTTP servers. On mature codebases, METR's randomized trial found experienced developers 19% slower with AI while believing they were 20% faster. ROI extrapolated from the demo condition to the whole backlog isn't ROI; it's a press release.
Third, perception can't referee. The METR developers missed the sign of the effect on their own work; the full story is in the AI productivity paradox. If expert self-assessment fails that badly, "the team says it's a game-changer" cannot be the value side of your equation.
The cost side: what the tools actually spend
Seats are the smallest line item, which is why they're the one everyone prices. The real costs are downstream, and each one is measurable in your own git history:
- Rework. Code rewritten shortly after shipping was paid for twice: written, reviewed, merged, deployed, then again. Short-window churn is the direct gauge; AI code churn covers how to measure it and how to split healthy iteration from expensive regression. Your overall rework rate is the same instrument pointed at the whole team.
- Defect flow. Faros AI measured bugs per developer up 54% at high AI adoption. Every one of those bugs is engineer-hours on the cost side: triage, fix, review, deploy, and sometimes an incident call.
- Maintenance liability. GitClear's same dataset measured code-block duplication up 81% and refactoring line-moves down about 70%: code piling up beside old code instead of replacing it. That bill hasn't arrived yet, which is exactly why nobody prices it; technical debt from AI-generated code is the itemization.
- Review burden. Generation multiplied output volume; it did not multiply reviewer hours. If PR volume and size rose while review depth fell, part of your "productivity gain" is unreviewed risk relocating downstream, a cost that surfaces as the defect and rework lines above.
The value side: what actually counts as return
Value is delivery outcomes moving, on your repo, in metrics that survive an audit:
- Cycle time, end to end. First commit to merge to deploy. If AI buys real speed, it shows up here rather than in lines generated.
- Throughput of completed work. Work items delivered, not PRs opened. Volume metrics inflate under generation; completion metrics don't.
- Quality holding or improving. A speedup purchased with a rising defect rate is a loan.
And one org-level caution while you count: DORA's 2024 report found AI adoption improved individual productivity, flow, and job satisfaction, while its estimates associated a 25% increase in AI adoption with a 1.5% decrease in delivery throughput and a 7.2% decrease in delivery stability. Individual gains and organizational losses can coexist. Measure at the level you're paying for.
An honest ROI method, step by step
- Baseline before you judge. Pull at least a quarter of pre-rollout data: cycle time, review pickup and depth, short-window churn, defect counts. No baseline, no ROI - only vibes with a start date.
- Attribute explicitly or don't split. Compare AI-assisted versus non-assisted work only via explicit signals: commit trailers, bot and agent accounts, tool-attributed commits. ML fingerprinting that guesses "this looks generated" poisons the denominator. If you can't attribute cleanly, measure the repo-wide trend across the adoption boundary instead.
- Fix the rework window and keep it fixed. Two weeks post-merge is the research convention. Changing the window changes the number; pick once, compare trends.
- Count rework against the gains. Hours saved on generation minus hours spent on churn, defect fixes, and added review is the only subtraction that deserves the name ROI.
- Denominate in engineer-hours at loaded cost. Both sides of the ledger convert to money through the same rate, your fully loaded cost of an engineer, which keeps the comparison honest and CFO-legible.
- Judge trends over quarters. One sprint proves nothing in either direction. Every credible study in this field measured over months; your renewal decision deserves the same.
The uncomfortable, useful answer
Run this honestly and you'll likely land somewhere unfashionable: AI coding tools earning their seats on some work, costing money on other work, with the split visible per team and per codebase area. That's the evaluation working. It tells you where to expand, where to add guardrails, and where the tool is generating debt faster than value. The wider evidence map, covering what helps, what hurts, and why the studies disagree, is in AI-assisted development: what the evidence says.
The teams that renew on measured ROI get compounding returns. The teams that renew on acceptance rate get a dashboard that says everything is fine, right up until the churn data says otherwise. Knowing costs a few git queries. Not knowing costs the difference.
Frequently asked
Why isn't acceptance rate a good ROI metric for AI coding tools?
Acceptance rate measures how often developers keep a suggestion, not what the suggestion did to delivery. An accepted line that gets rewritten two weeks later scored as a win at acceptance time and became a cost afterward. ROI needs both sides of the ledger, outcomes gained and rework incurred, and acceptance rate sees neither.
What's the minimum honest setup for measuring AI coding ROI?
A baseline of cycle time, review metrics, and short-window churn from before rollout; explicit AI attribution via commit trailers or bot accounts where possible; a fixed rework window (two weeks post-merge is the research convention); and at least a quarter of data. That's a few queries against git history, not a platform purchase.
How do I put the ROI in money terms a CFO accepts?
Denominate both sides in engineer-hours at loaded cost. Gains: hours saved via measured cycle-time and throughput deltas, not self-reported feel. Costs: seats, plus hours spent on rework of AI-assisted code, extra review load, and defect fixes attributable to the adoption window. If the hours on the cost side aren't measured, the ROI number is fiction with a currency symbol.
Receipts
- METR - Measuring the Impact of Early-2025 AI on Experienced Open-Source Developer Productivity (RCT)
- Peng, Kalliamvakou, Cihon, Demirer - The Impact of AI on Developer Productivity: Evidence from GitHub Copilot (arXiv:2302.06590)
- GitClear - The AI Code Quality Maintainability Gap (2026, 623M code changes)
- Faros AI - AI Acceleration Whiplash, AI Engineering Report 2026
- DORA - Accelerate State of DevOps Report 2024