Developer Experience Metrics (SPACE, Explained)
SPACE, WITHOUT THE FLUFF
The SPACE framework explained: five dimensions of developer experience, what each one actually measures, and how to use DevEx metrics without surveillance.
Flat and well above the elite reference - a signal, not a verdict.
Illustrative example
TL;DR: SPACE (Satisfaction, Performance, Activity, Communication, Efficiency) is the closest thing developer experience has to a standard measurement theory. Its core claim: productivity "cannot be measured by a single metric or dimension." The practical advice is to measure at least three dimensions, include at least one perceptual measure, and keep the metrics in tension so no single number can be gamed. And the sharpest edge, routinely ignored: activity counts are the weakest dimension and the one most abused for ranking people.
Every few years engineering leadership rediscovers the same temptation: find the number that says who's productive. Lines of code had its era. Commit counts had one. Story points still refuse to die. The SPACE framework, published in ACM Queue in 2021 by Nicole Forsgren, Margaret-Anne Storey, Chandra Maddila, Thomas Zimmermann, Brian Houck, and Jenna Butler, exists to kill that temptation with evidence, and to replace it with something a serious team can actually run on. If you're weighing it against the other measurement frameworks, the DORA vs SPACE vs DevEx decision guide maps which one answers which question; this piece goes deep on SPACE itself.
What developer experience is, and why it's worth measuring
Developer experience (DevEx) is the everyday reality of building software in your org: how long feedback takes, how much friction sits between an idea and a shipped change, how it feels to do the work. That sounds like a perk. It's the operating condition of your most expensive capacity. The 2024 Stack Overflow survey gives a taste of what poor DevEx costs at industry scale: 61% of developers spend more than 30 minutes a day just searching for answers or solutions, and 63% name technical debt their top frustration. Those are experience failures, and they compound into the team-health failures that end in resignations.
Measuring DevEx is how you find the friction before your exit interviews do. SPACE is the map for doing it without lying to yourself.
The five SPACE dimensions, explained
S - Satisfaction and well-being. How developers feel about their work, team, tools, and culture, burnout included. This dimension is irreducibly perceptual: you get it by asking. It's also the leading indicator; satisfaction usually degrades before delivery does.
P - Performance. Outcomes rather than output: did the software deliver quality, reliability, customer value? Performance is the dimension everyone wants and the hardest to attribute to any individual, which is precisely why SPACE treats it as a systems measure.
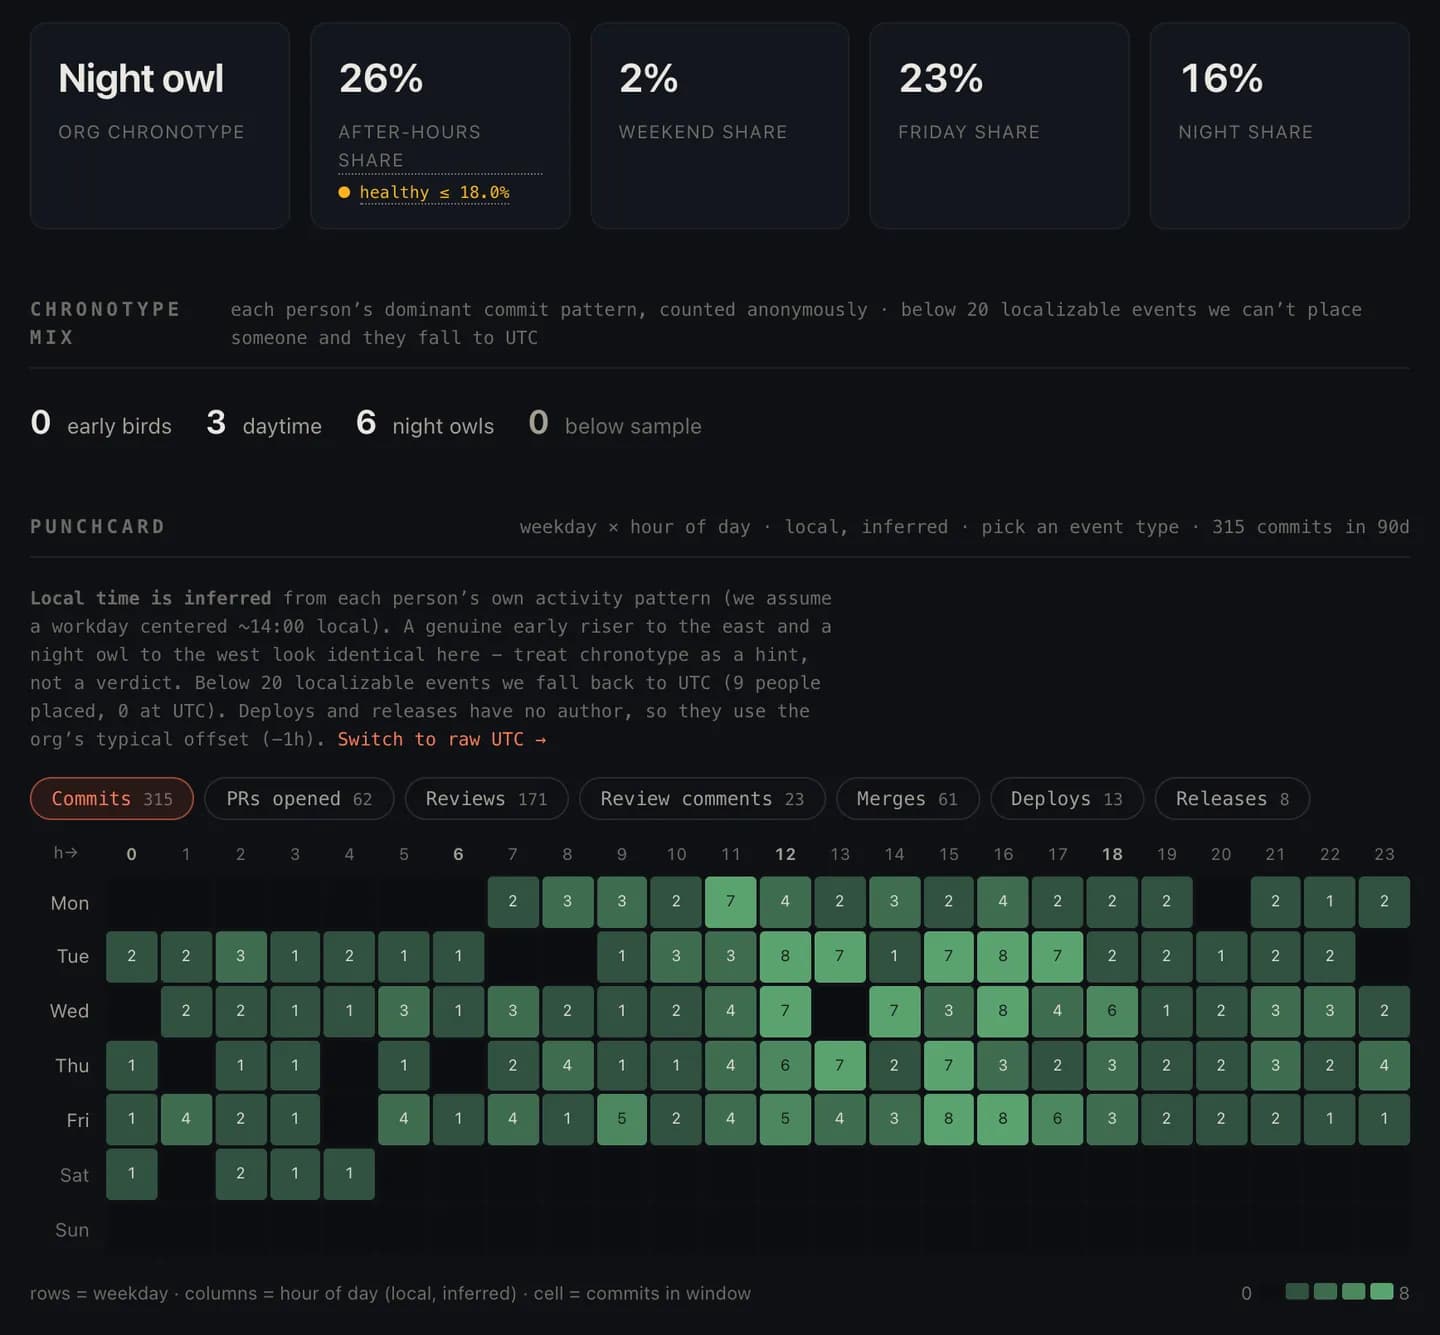
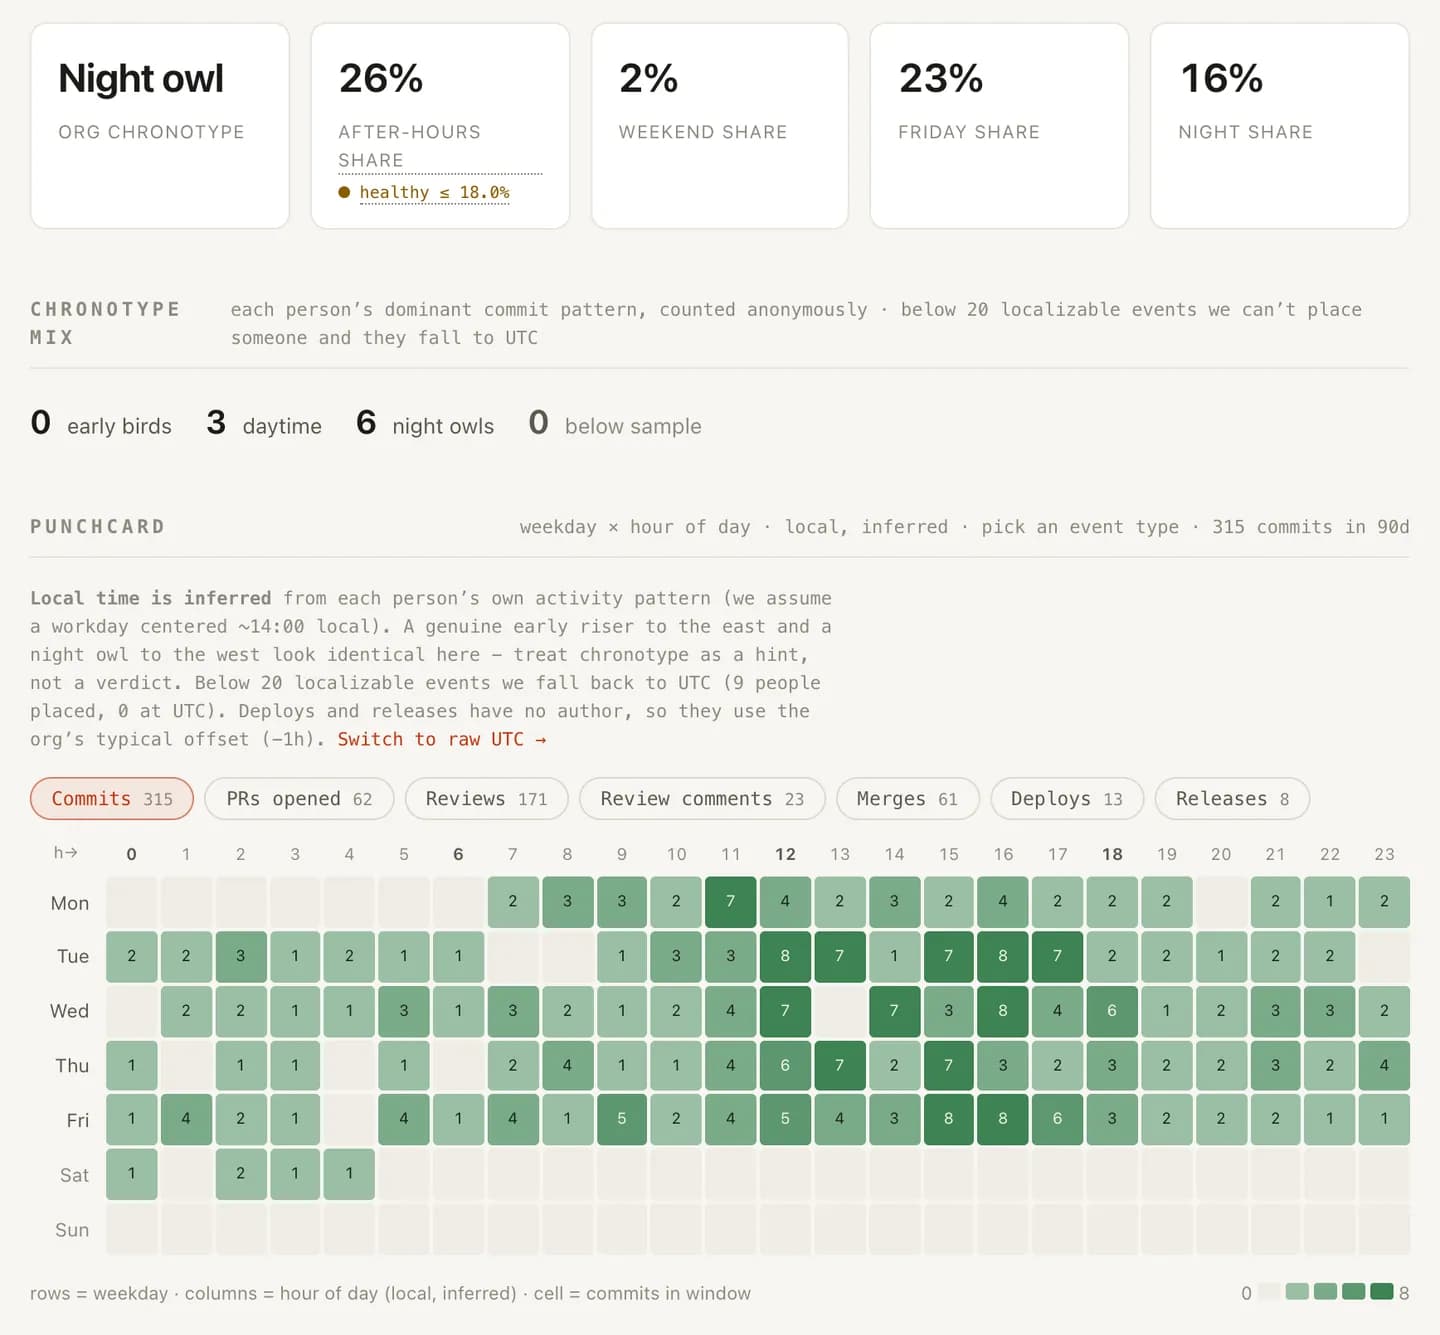
A - Activity. Counts of things: commits, PRs, reviews, builds. Activity data is cheap, plentiful, and the most dangerous dimension in the framework. It's genuinely useful as a system signal (where work happens, where it pools, where it stalls) and genuinely toxic as an individual score. It measures motion, not progress, and every activity count can be gamed the day it becomes a target.
C - Communication and collaboration. How work and knowledge flow between people: how discoverable expertise is, how quickly reviews turn around, how well newcomers get integrated. This is where knowledge silos and review bottlenecks live, and it's the dimension most predictive of what happens when someone leaves.
E - Efficiency and flow. The ability to make progress with minimal interruptions and delays: few handoffs, short waits, protected deep-work time. Most of what engineers mean when they say the work feels bad lives here, and most of it is measurable from timestamps: PR pickup time alone will tell you more about daily developer experience than any velocity chart.
How to measure DevEx without surveilling anyone
SPACE's operating instructions are short and widely skipped:
- Use at least three dimensions. The authors recommend selecting metrics across a minimum of three of the five, deliberately, because dimensions check each other. A team whose activity is up while satisfaction craters is a burnout in progress that a single-metric dashboard would celebrate.
- Include at least one perceptual measure. System data tells you a review took 26 hours; only a human can tell you whether that blocked them or nobody cared. The framework insists on pairing telemetry with how the work actually feels.
- Keep metrics in tension. If all your numbers can improve simultaneously by doing the wrong thing (smaller-but-meaningless PRs, rubber-stamp reviews), your metric set has no immune system. Good pairs pull against each other: review speed against review depth, activity against satisfaction, throughput against quality.
And the rule the paper's authors would recognize even though your vendor won't: aggregate at the team and system level, never rank individuals. The moment a DevEx metric becomes a per-person leaderboard, developers optimize for the leaderboard, the data degrades into theater, and the trust you needed for the perceptual half evaporates. Activity counts in particular were never designed to compare humans - a code-review-heavy staff engineer and a feature-shipping mid-level developer are both doing exactly their jobs while producing wildly different activity profiles.
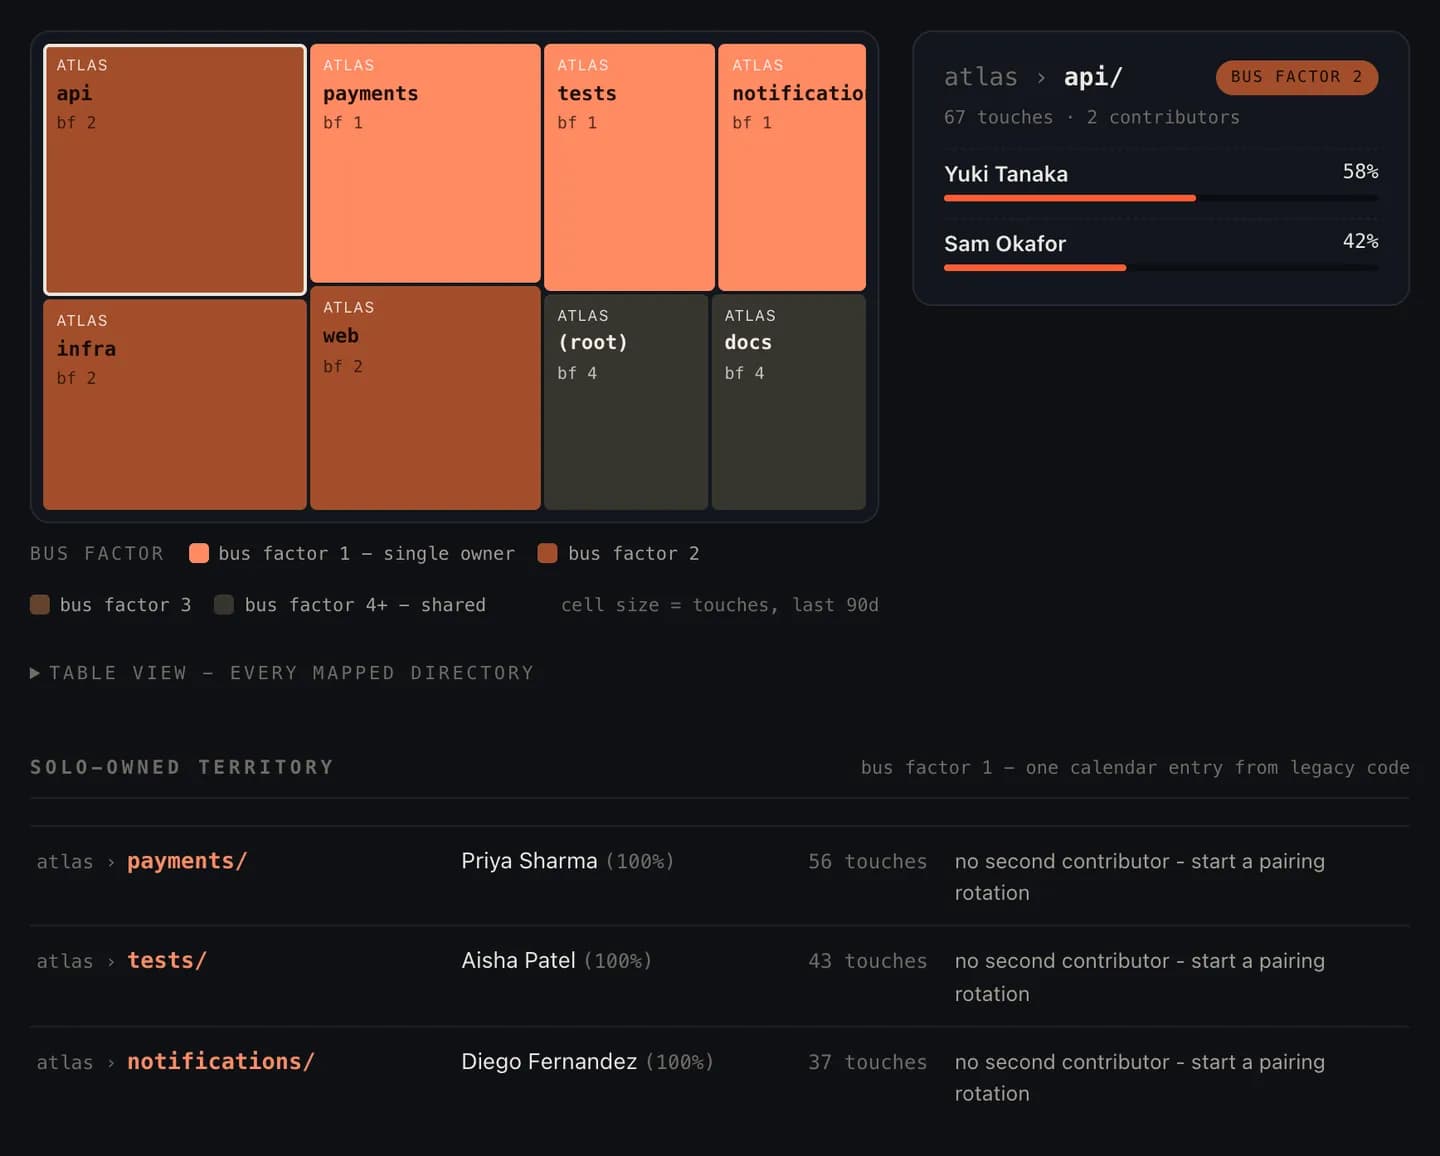
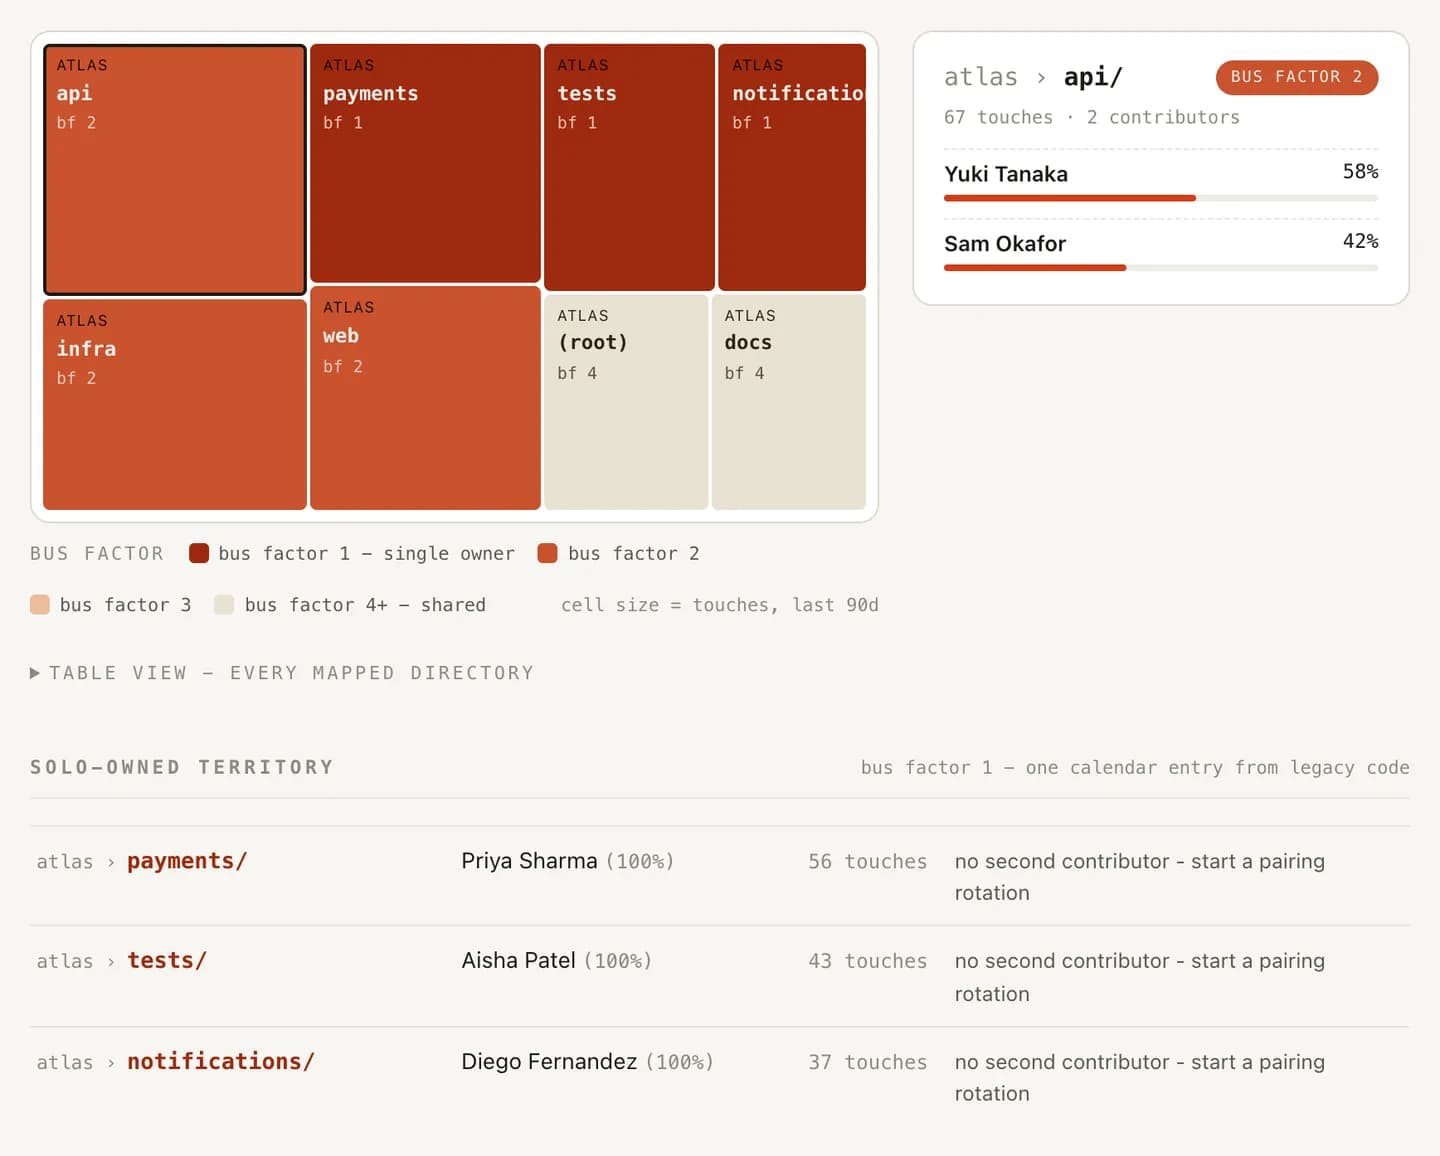
There's a version of per-person visibility that is legitimate: understanding what each person uniquely carries, where they're overloaded, and what the org loses if they walk. The purpose is protection and growth. That's a scorecard, not a stack-rank, and the difference is the entire ballgame. It's also the honest lens on key-person risk: the point of knowing who's irreplaceable is to protect them and spread the load, never to grade them against a peer.
Where to start this quarter
Don't boil the framework. A minimal honest SPACE setup, from data you already have plus one survey:
- Efficiency/flow: PR pickup time and review round-trips from git history. The cost of the queue is the easiest DevEx win to price, in payroll terms your CFO will accept.
- Communication/collaboration: review-load distribution and knowledge concentration (who reviews what, which areas have one owner, how fast newcomers ramp).
- Satisfaction: a short quarterly pulse - five questions, free text encouraged, results shared back to the team unedited.
Three dimensions, one perceptual measure, all system-level, nothing that requires new tooling to begin. Then act on the worst number where the team's account and the telemetry agree. That intersection is the one place a metric has ever deserved to be trusted.
Frequently asked
What is the SPACE framework?
A developer-productivity framework by Forsgren, Storey, Maddila, Zimmermann, Houck, and Butler (ACM Queue, 2021). It defines five dimensions (Satisfaction and well-being, Performance, Activity, Communication and collaboration, Efficiency and flow) and argues productivity can't be captured by any single metric.
How many SPACE dimensions should you measure?
The authors recommend measuring across at least three of the five dimensions and including at least one perceptual measure (how the work feels to developers) alongside system data. Metrics chosen from different dimensions deliberately stay in tension, which is what keeps any one of them from being gamed.
Are developer experience metrics surveillance?
They become surveillance the moment they score individuals. Used correctly, DevEx metrics describe the system (wait times, friction, tooling, knowledge flow) and are paired with the team's own account of the work. Aggregate at team level, share openly, and never rank people.
What's the difference between DORA and SPACE?
DORA measures software delivery outcomes with four keys like lead time and deployment frequency. SPACE is broader: a lens on developer productivity and experience itself, including satisfaction and collaboration. They complement each other - DORA tells you how delivery is going, SPACE helps explain why.