Code Review Metrics That Matter (and Four That Don't)
FOUR METRICS THAT LIE
Code review metrics worth tracking - pickup time, coverage, size, load - the vanity numbers that reward speed-approving, and how each one gets gamed.
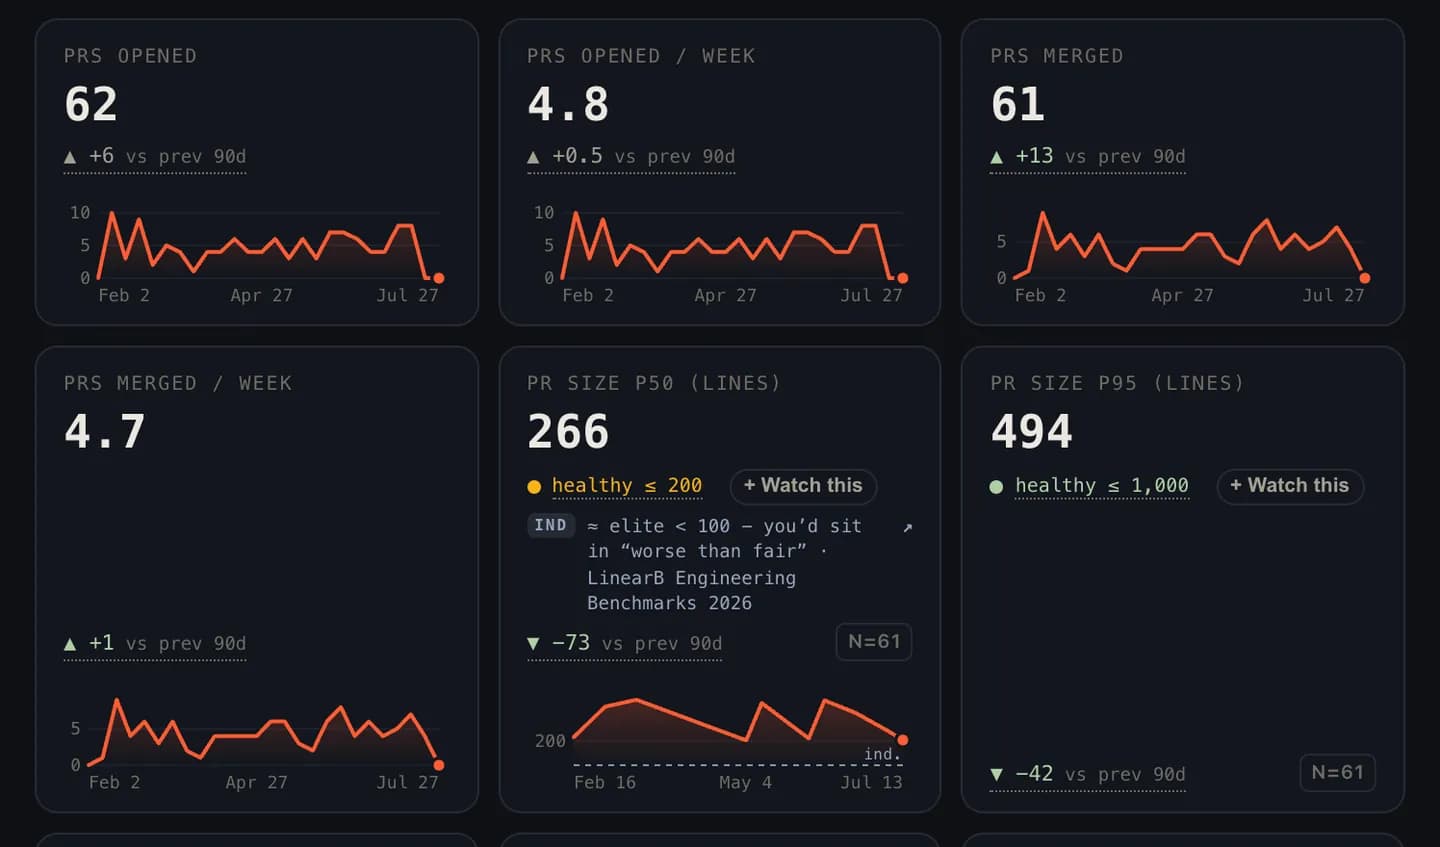
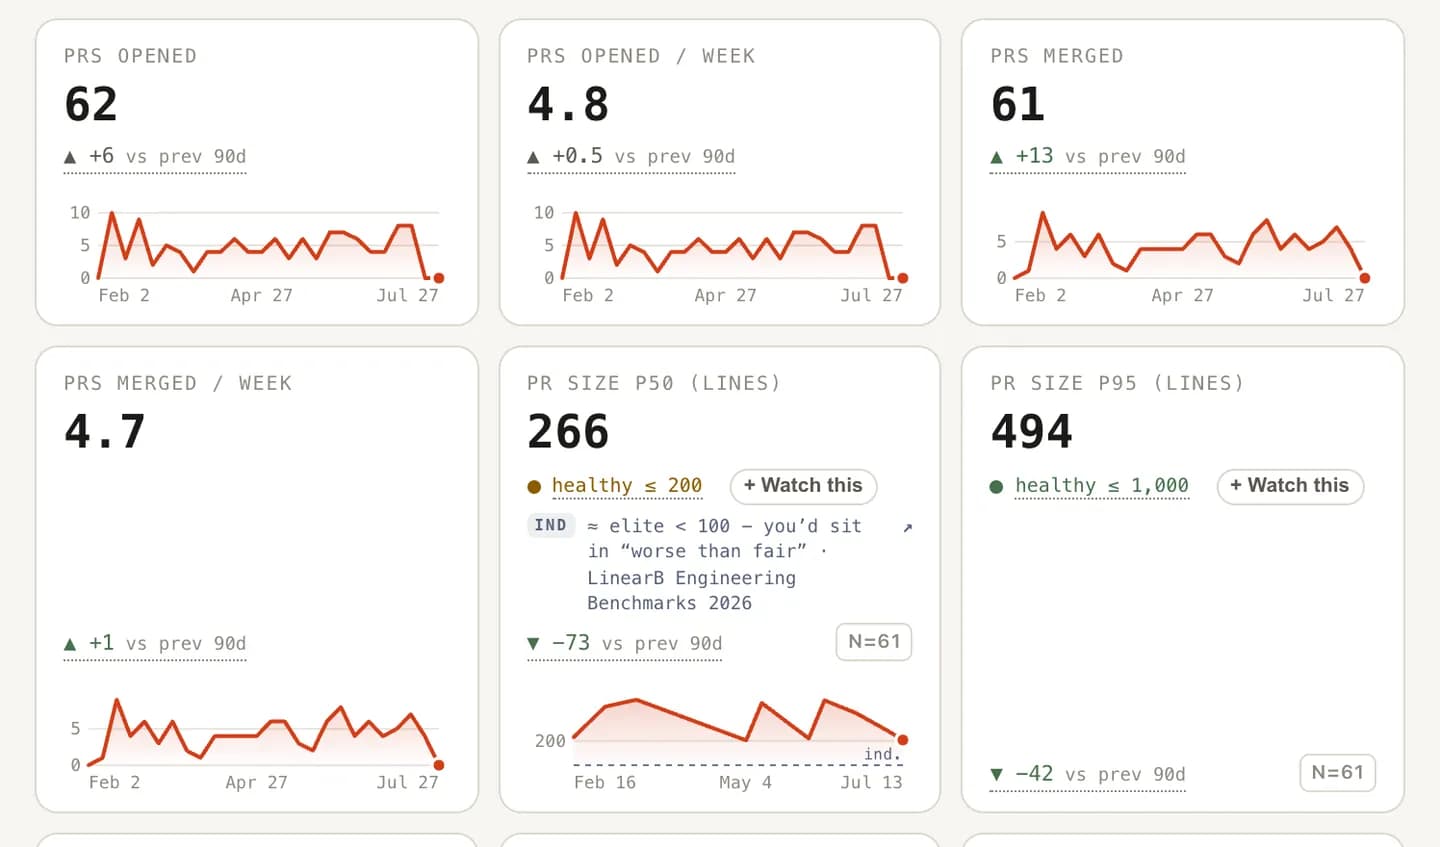
Flat and well above the elite reference - a signal, not a verdict.
Illustrative example
TL;DR: Four review metrics carry nearly all the signal: pickup time, review coverage, PR size, and review load distribution - wait, existence, cost, and concentration. Each has a published bar to calibrate against. Meanwhile the dashboard darlings (comment counts, reviewer counts, time-to-merge alone, per-person leaderboards) mostly measure theater, and optimizing them produces more of it. Track the four, in pairs, by repo, never by ranked human.
Code review generates more metrics per square meter than any other part of the pipeline: every PR emits timestamps, counts, and participants, and every analytics tool graphs all of it by default. The result is dashboard abundance and diagnostic poverty. Teams stare at comment-count trends while a third of their code merges unreviewed. The stakes are real, too: the 2023 DORA report found teams with faster code review show 50% higher software delivery performance. So separate the metrics that diagnose from the metrics that decorate.
Which code review metrics actually matter?
Four. Each answers a question the others can't, and together they cover the whole failure surface: reviews that start late, never happen, cost too much, or all land on one person.
| Metric | The question it answers | Published bar | Deep dive |
|---|---|---|---|
| Pickup time | How long does a PR wait for a first look? | LinearB: elite <1h, good 1-4h, >16h needs focus | PR pickup time |
| Review coverage | What share of merged code did a second person read? | Google: essentially every change reviewed, median one approver | Review coverage |
| PR size | Are changes small enough to review well? | LinearB: elite <100 changed lines; Cisco/SmartBear: ≤200-400 LOC per session | Small pull requests |
| Review load | Is reviewing spread, or is one person the whole safety net? | No published band; watch concentration and trend | Review load |
Why these four earn the dashboard: they're causal levers, not just outcomes. Shrink PRs and pickup improves, because starting a 100-line diff costs less. Improve pickup and coverage improves: nobody self-merges out of impatience when first response comes in under an hour, as it does for small changes at Google. Spread load and pickup stops depending on one person's calendar. The four reinforce each other, which is exactly what you want from a metric set. Pulling any lever moves the others the right way.
Four code review metrics that mislead
These show up on default dashboards, and each one rewards the wrong behavior when watched:
- Comment count as review depth. Zero comments might be a rubber stamp, or a clean small PR from a trusted author, which is the system working. Fifteen comments might be rigor or a style war a linter should have prevented. The number doesn't distinguish signal from noise, and per the research on what reviews actually catch, the highest-value review outcomes (clarity, knowledge transfer) don't correlate with comment volume anyway. Watched, it breeds performative nitpicking.
- Reviewers per PR. "More eyes" reads as rigor and delivers diffusion: five requested reviewers is five people assuming someone else has it. Google merges the median change with a single approver while reviewing essentially everything. One accountable reader beats a committee; counting the committee measures nothing.
- Time-to-merge, alone. The seductive one, because it's a real cost - slow reviews bill you in payroll. But optimized in isolation, it has one easy exploit: approve without reading. Merge time falls, dashboards glow, and the review pipeline quietly stops existing. Speed metrics are structurally blind to whether the thing they're timing actually happened.
- Per-person review leaderboards. Ranking humans by approvals-per-week optimizes for exactly the fast, shallow behavior that makes review worthless, and teaches your most careful reviewers that care is penalized. Load distribution matters enormously, but as a system rebalancing signal rather than a scoreboard. The distinction is the whole game.
How code review metrics get gamed
Goodhart's law arrives on schedule the moment any measure becomes a target. A pickup-time SLA breeds the placeholder "looking!" comment that stops the clock and reads nothing. A hard size limit breeds confetti-splitting: six 80-line PRs that can only be understood together, which is a 480-line review with extra steps. A coverage mandate breeds the one-second approval, which satisfies the letter of "a second person was present" while abandoning the point.
The antidote is pairing. Each speed metric gets a quality partner, so gaming one number surfaces in another:
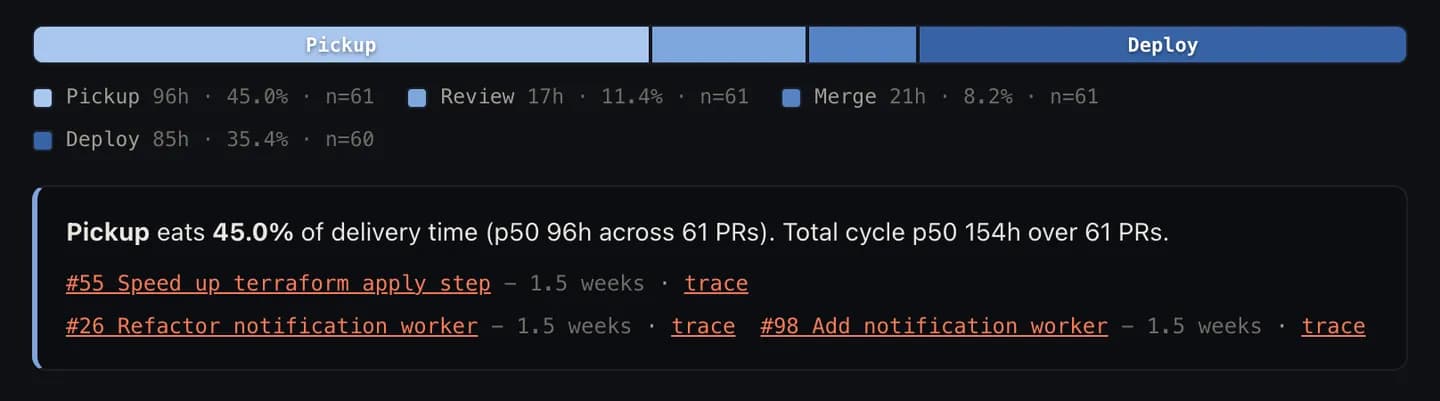
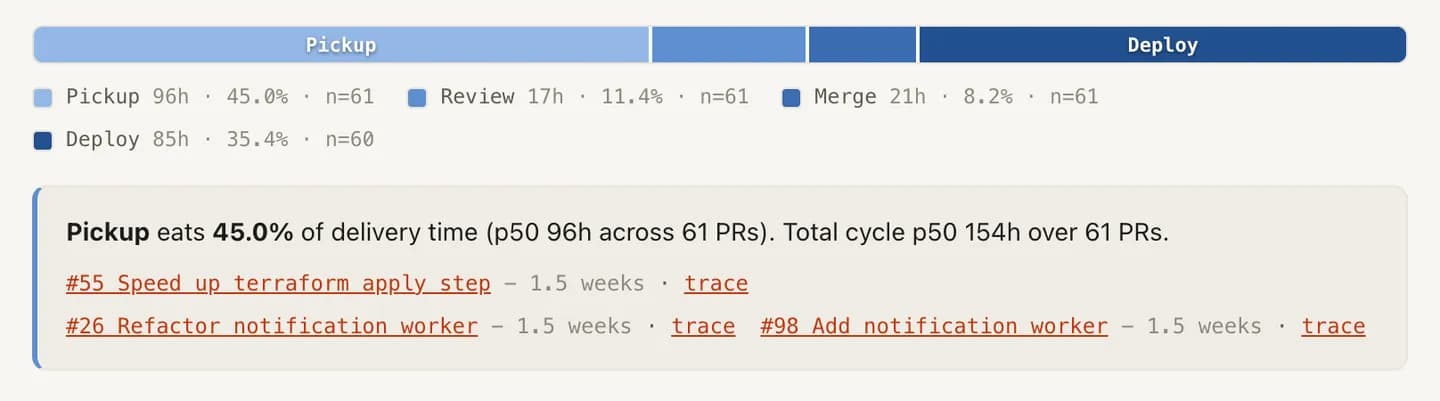
- Pickup time + review time. Instant pickups followed by one-second reviews is theater, visible as a pair.
- Coverage + depth spot-checks. The percentage plus an occasional human look at whether approvals carry any evidence of reading.
- PR size + linked-PR awareness. Small diffs are the goal; small fragments of an unsplittable change are not, and the difference shows in how PRs cluster. The honest version of small is in small pull requests.
Paired metrics lie less because faking both sides costs more than doing the work.
Rolling out review metrics without theater
Four rules, all boring, all load-bearing:
- Trends over snapshots. This week's pickup number is weather; the quarter's slope is climate. React to slopes.
- Segment by repo and path, not person. A healthy org-wide average routinely hides one repo where review has quietly died. The cluster is the finding.
- Set bars as working agreements, not surveillance. "First response within four working hours" agreed in the open beats a threshold imposed from a dashboard - same number, opposite culture. The fixes are in reducing review time.
- Discuss in retros, not 1:1s. Review metrics diagnose a system. The moment one is used on an individual, every number after it is performance art.
Start with the four - pickup, coverage, size, load - measured monthly, segmented by repo, discussed as a team. Delete the vanity charts without ceremony; nobody will miss them. The point was never a fuller dashboard. It's the short list of numbers that, when they move, mean something real moved, and that, when you act on them, move back.
Frequently asked
What are the most important code review metrics?
Four cover the failure surface: pickup time (how long PRs wait for a first look), review coverage (the share of merged code a second person actually read), PR size (whether changes are small enough to review well), and review load distribution (whether reviewing is concentrated on one or two people). Each catches a failure the others miss.
What is a good benchmark for code review speed?
LinearB's benchmarks (built from 8.1 million+ PRs across 4,800 teams) put elite pickup time under 1 hour and good at 1-4 hours, with over 16 hours flagged as needing focus. Google's internal study of ~9M changes reports an overall median reviewer response under 4 hours, and under an hour for small changes.
Should you measure individual reviewer performance?
Measure load distribution to rebalance the system, not to rank people. A per-person review leaderboard optimizes for volume of approvals, which is precisely the behavior that makes reviews shallow. Review metrics are system diagnostics; the moment one becomes a personal score, it stops measuring and starts performing.
Why do review metrics get gamed?
Goodhart's law: when a measure becomes a target, it stops being a good measure. A pickup-time SLA breeds placeholder 'looking!' comments; a size limit breeds meaningless PR-splitting; a coverage mandate breeds one-second approvals. The fix is pairing each speed metric with a quality check so gaming one number shows up in another.